Central American Indian vs Sri Lankan 1st Grade
COMPARE
Central American Indian
Sri Lankan
1st Grade
1st Grade Comparison
Central American Indians
Sri Lankans
97.1%
1ST GRADE
0.0/ 100
METRIC RATING
297th/ 347
METRIC RANK
96.9%
1ST GRADE
0.0/ 100
METRIC RATING
311th/ 347
METRIC RANK
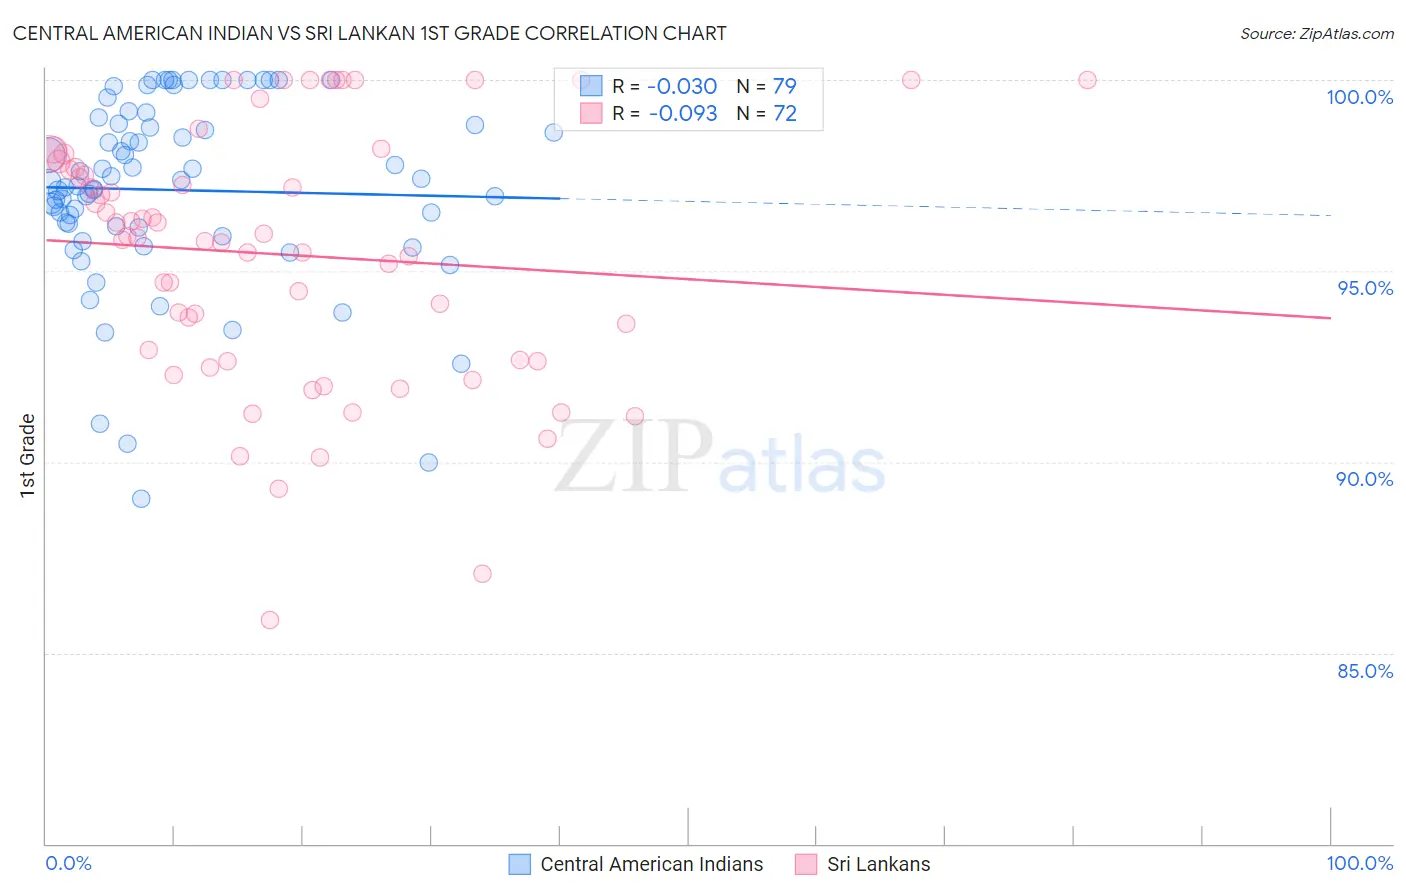
Central American Indian vs Sri Lankan 1st Grade Correlation Chart
The statistical analysis conducted on geographies consisting of 326,141,567 people shows no correlation between the proportion of Central American Indians and percentage of population with at least 1st grade education in the United States with a correlation coefficient (R) of -0.030 and weighted average of 97.1%. Similarly, the statistical analysis conducted on geographies consisting of 440,593,746 people shows a slight negative correlation between the proportion of Sri Lankans and percentage of population with at least 1st grade education in the United States with a correlation coefficient (R) of -0.093 and weighted average of 96.9%, a difference of 0.22%.
1st Grade Correlation Summary
| Measurement | Central American Indian | Sri Lankan |
| Minimum | 89.0% | 85.9% |
| Maximum | 100.0% | 100.0% |
| Range | 11.0% | 14.1% |
| Mean | 97.1% | 95.4% |
| Median | 97.3% | 95.9% |
| Interquartile 25% (IQ1) | 96.2% | 92.7% |
| Interquartile 75% (IQ3) | 98.9% | 97.8% |
| Interquartile Range (IQR) | 2.7% | 5.1% |
| Standard Deviation (Sample) | 2.5% | 3.3% |
| Standard Deviation (Population) | 2.4% | 3.3% |
Demographics Similar to Central American Indians and Sri Lankans by 1st Grade
In terms of 1st grade, the demographic groups most similar to Central American Indians are Immigrants from Dominica (97.1%, a difference of 0.020%), Immigrants from Cuba (97.1%, a difference of 0.020%), Haitian (97.1%, a difference of 0.030%), Immigrants (97.2%, a difference of 0.050%), and Immigrants from Eritrea (97.2%, a difference of 0.050%). Similarly, the demographic groups most similar to Sri Lankans are Cape Verdean (96.9%, a difference of 0.0%), Guyanese (96.9%, a difference of 0.010%), Immigrants from the Azores (96.9%, a difference of 0.020%), Immigrants from Somalia (96.9%, a difference of 0.030%), and Hispanic or Latino (96.9%, a difference of 0.030%).
| Demographics | Rating | Rank | 1st Grade |
| Immigrants | Grenada | 0.0 /100 | #294 | Tragic 97.2% |
| Immigrants | Immigrants | 0.0 /100 | #295 | Tragic 97.2% |
| Immigrants | Eritrea | 0.0 /100 | #296 | Tragic 97.2% |
| Central American Indians | 0.0 /100 | #297 | Tragic 97.1% |
| Immigrants | Dominica | 0.0 /100 | #298 | Tragic 97.1% |
| Immigrants | Cuba | 0.0 /100 | #299 | Tragic 97.1% |
| Haitians | 0.0 /100 | #300 | Tragic 97.1% |
| Immigrants | South Eastern Asia | 0.0 /100 | #301 | Tragic 97.1% |
| Immigrants | Caribbean | 0.0 /100 | #302 | Tragic 97.0% |
| Somalis | 0.0 /100 | #303 | Tragic 97.0% |
| Nicaraguans | 0.0 /100 | #304 | Tragic 97.0% |
| Ecuadorians | 0.0 /100 | #305 | Tragic 97.0% |
| Belizeans | 0.0 /100 | #306 | Tragic 96.9% |
| Immigrants | Somalia | 0.0 /100 | #307 | Tragic 96.9% |
| Hispanics or Latinos | 0.0 /100 | #308 | Tragic 96.9% |
| Immigrants | Haiti | 0.0 /100 | #309 | Tragic 96.9% |
| Immigrants | Azores | 0.0 /100 | #310 | Tragic 96.9% |
| Sri Lankans | 0.0 /100 | #311 | Tragic 96.9% |
| Cape Verdeans | 0.0 /100 | #312 | Tragic 96.9% |
| Guyanese | 0.0 /100 | #313 | Tragic 96.9% |
| Hondurans | 0.0 /100 | #314 | Tragic 96.9% |