Central American Indian vs Immigrants from Argentina Receiving Food Stamps
COMPARE
Central American Indian
Immigrants from Argentina
Receiving Food Stamps
Receiving Food Stamps Comparison
Central American Indians
Immigrants from Argentina
17.1%
RECEIVING FOOD STAMPS
0.0/ 100
METRIC RATING
316th/ 347
METRIC RANK
11.2%
RECEIVING FOOD STAMPS
80.4/ 100
METRIC RATING
155th/ 347
METRIC RANK
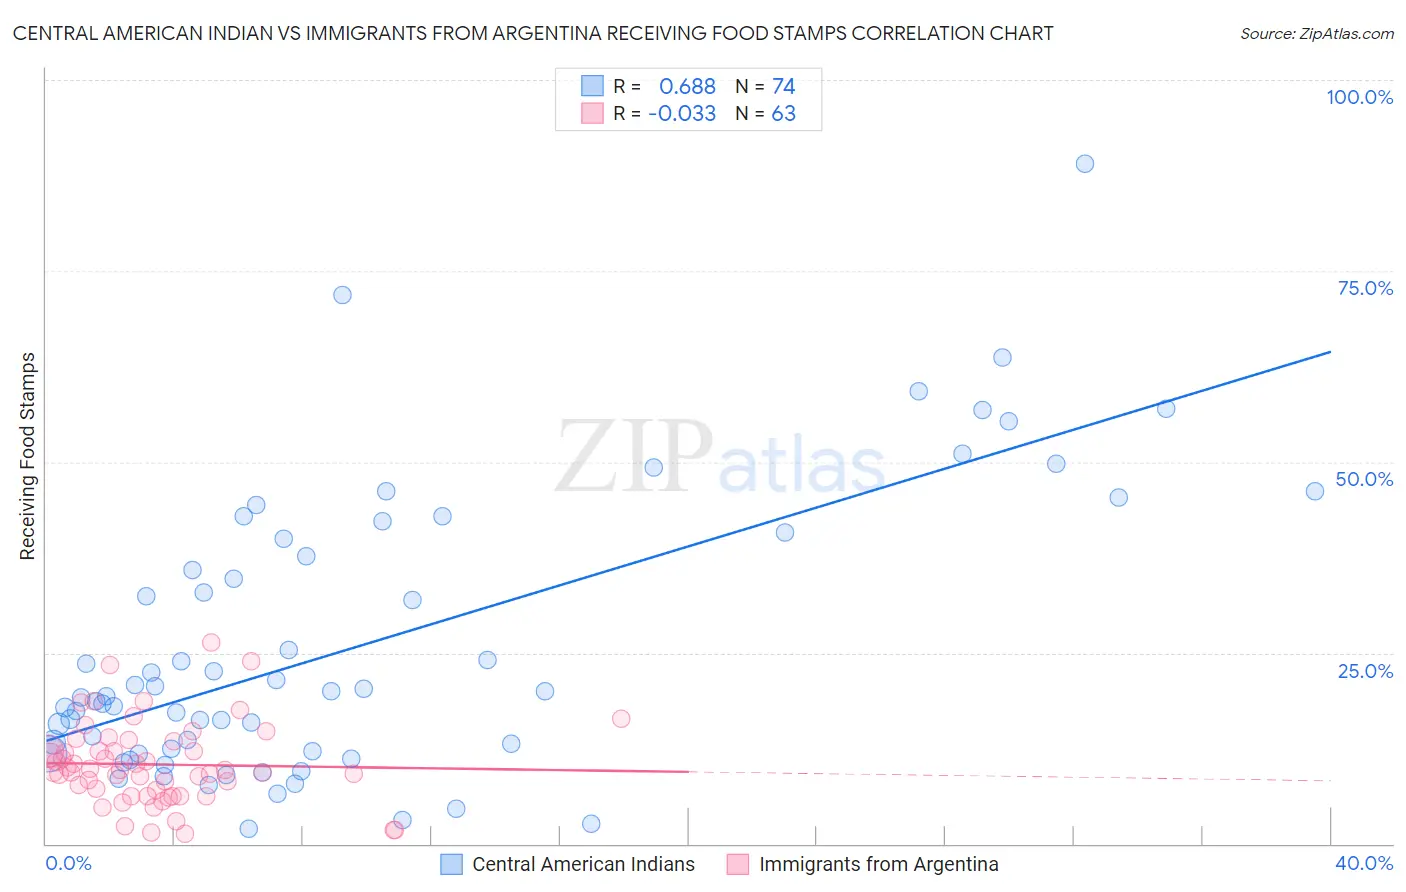
Central American Indian vs Immigrants from Argentina Receiving Food Stamps Correlation Chart
The statistical analysis conducted on geographies consisting of 325,864,154 people shows a significant positive correlation between the proportion of Central American Indians and percentage of population receiving government assistance and/or food stamps in the United States with a correlation coefficient (R) of 0.688 and weighted average of 17.1%. Similarly, the statistical analysis conducted on geographies consisting of 263,859,241 people shows no correlation between the proportion of Immigrants from Argentina and percentage of population receiving government assistance and/or food stamps in the United States with a correlation coefficient (R) of -0.033 and weighted average of 11.2%, a difference of 53.0%.
Receiving Food Stamps Correlation Summary
| Measurement | Central American Indian | Immigrants from Argentina |
| Minimum | 1.9% | 1.4% |
| Maximum | 89.1% | 26.3% |
| Range | 87.2% | 24.9% |
| Mean | 25.9% | 10.4% |
| Median | 19.6% | 9.6% |
| Interquartile 25% (IQ1) | 12.1% | 6.3% |
| Interquartile 75% (IQ3) | 40.0% | 13.4% |
| Interquartile Range (IQR) | 27.9% | 7.1% |
| Standard Deviation (Sample) | 18.3% | 5.3% |
| Standard Deviation (Population) | 18.2% | 5.3% |
Similar Demographics by Receiving Food Stamps
Demographics Similar to Central American Indians by Receiving Food Stamps
In terms of receiving food stamps, the demographic groups most similar to Central American Indians are Bahamian (17.0%, a difference of 0.45%), Black/African American (17.2%, a difference of 0.53%), Menominee (17.2%, a difference of 0.70%), Immigrants from St. Vincent and the Grenadines (17.2%, a difference of 0.88%), and Immigrants from Nicaragua (17.2%, a difference of 0.96%).
| Demographics | Rating | Rank | Receiving Food Stamps |
| U.S. Virgin Islanders | 0.0 /100 | #309 | Tragic 16.5% |
| Immigrants | Barbados | 0.0 /100 | #310 | Tragic 16.6% |
| Guyanese | 0.0 /100 | #311 | Tragic 16.7% |
| Sioux | 0.0 /100 | #312 | Tragic 16.8% |
| Immigrants | Jamaica | 0.0 /100 | #313 | Tragic 16.9% |
| Immigrants | Guyana | 0.0 /100 | #314 | Tragic 16.9% |
| Bahamians | 0.0 /100 | #315 | Tragic 17.0% |
| Central American Indians | 0.0 /100 | #316 | Tragic 17.1% |
| Blacks/African Americans | 0.0 /100 | #317 | Tragic 17.2% |
| Menominee | 0.0 /100 | #318 | Tragic 17.2% |
| Immigrants | St. Vincent and the Grenadines | 0.0 /100 | #319 | Tragic 17.2% |
| Immigrants | Nicaragua | 0.0 /100 | #320 | Tragic 17.2% |
| Natives/Alaskans | 0.0 /100 | #321 | Tragic 17.3% |
| Immigrants | Grenada | 0.0 /100 | #322 | Tragic 17.8% |
| Haitians | 0.0 /100 | #323 | Tragic 17.8% |
Demographics Similar to Immigrants from Argentina by Receiving Food Stamps
In terms of receiving food stamps, the demographic groups most similar to Immigrants from Argentina are Armenian (11.1%, a difference of 0.25%), Lebanese (11.1%, a difference of 0.31%), Immigrants from Spain (11.1%, a difference of 0.33%), Immigrants from Kazakhstan (11.1%, a difference of 0.33%), and Soviet Union (11.1%, a difference of 0.69%).
| Demographics | Rating | Rank | Receiving Food Stamps |
| Immigrants | South Eastern Asia | 83.3 /100 | #148 | Excellent 11.1% |
| Brazilians | 83.2 /100 | #149 | Excellent 11.1% |
| Soviet Union | 83.1 /100 | #150 | Excellent 11.1% |
| Immigrants | Spain | 81.7 /100 | #151 | Excellent 11.1% |
| Immigrants | Kazakhstan | 81.7 /100 | #152 | Excellent 11.1% |
| Lebanese | 81.6 /100 | #153 | Excellent 11.1% |
| Armenians | 81.4 /100 | #154 | Excellent 11.1% |
| Immigrants | Argentina | 80.4 /100 | #155 | Excellent 11.2% |
| Immigrants | Afghanistan | 75.6 /100 | #156 | Good 11.3% |
| Immigrants | Lebanon | 75.2 /100 | #157 | Good 11.3% |
| Immigrants | Bosnia and Herzegovina | 72.6 /100 | #158 | Good 11.3% |
| Immigrants | Oceania | 70.4 /100 | #159 | Good 11.4% |
| French Canadians | 69.5 /100 | #160 | Good 11.4% |
| Pennsylvania Germans | 68.4 /100 | #161 | Good 11.4% |
| Alsatians | 68.0 /100 | #162 | Good 11.4% |