Central American Indian vs Guyanese Receiving Food Stamps
COMPARE
Central American Indian
Guyanese
Receiving Food Stamps
Receiving Food Stamps Comparison
Central American Indians
Guyanese
17.1%
RECEIVING FOOD STAMPS
0.0/ 100
METRIC RATING
316th/ 347
METRIC RANK
16.7%
RECEIVING FOOD STAMPS
0.0/ 100
METRIC RATING
311th/ 347
METRIC RANK
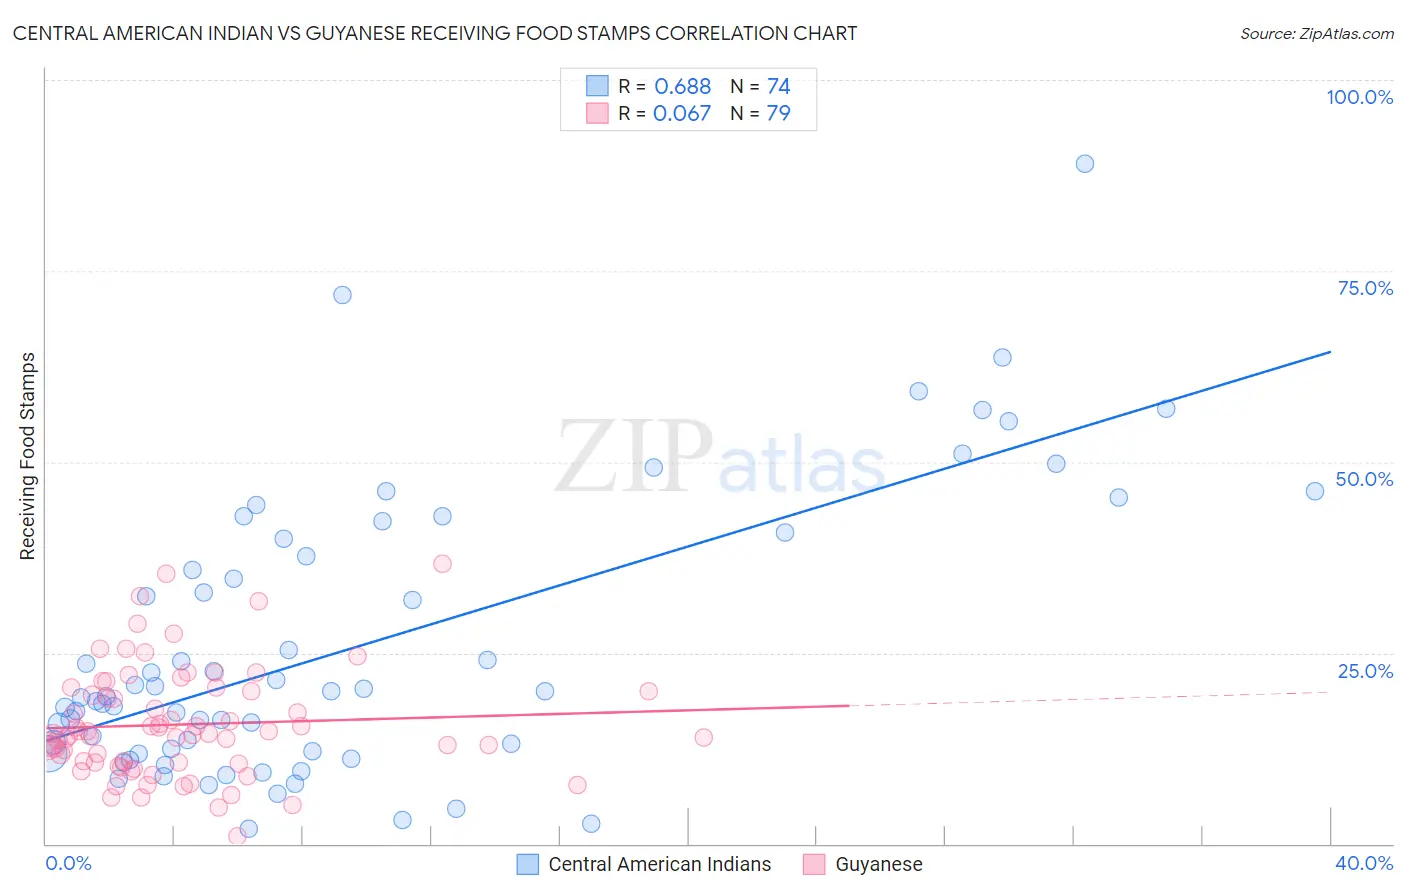
Central American Indian vs Guyanese Receiving Food Stamps Correlation Chart
The statistical analysis conducted on geographies consisting of 325,864,154 people shows a significant positive correlation between the proportion of Central American Indians and percentage of population receiving government assistance and/or food stamps in the United States with a correlation coefficient (R) of 0.688 and weighted average of 17.1%. Similarly, the statistical analysis conducted on geographies consisting of 176,625,032 people shows a slight positive correlation between the proportion of Guyanese and percentage of population receiving government assistance and/or food stamps in the United States with a correlation coefficient (R) of 0.067 and weighted average of 16.7%, a difference of 2.2%.
Receiving Food Stamps Correlation Summary
| Measurement | Central American Indian | Guyanese |
| Minimum | 1.9% | 1.0% |
| Maximum | 89.1% | 36.6% |
| Range | 87.2% | 35.6% |
| Mean | 25.9% | 15.6% |
| Median | 19.6% | 14.4% |
| Interquartile 25% (IQ1) | 12.1% | 10.6% |
| Interquartile 75% (IQ3) | 40.0% | 20.0% |
| Interquartile Range (IQR) | 27.9% | 9.4% |
| Standard Deviation (Sample) | 18.3% | 7.1% |
| Standard Deviation (Population) | 18.2% | 7.1% |
Demographics Similar to Central American Indians and Guyanese by Receiving Food Stamps
In terms of receiving food stamps, the demographic groups most similar to Central American Indians are Bahamian (17.0%, a difference of 0.45%), Black/African American (17.2%, a difference of 0.53%), Menominee (17.2%, a difference of 0.70%), Immigrants from St. Vincent and the Grenadines (17.2%, a difference of 0.88%), and Immigrants from Nicaragua (17.2%, a difference of 0.96%). Similarly, the demographic groups most similar to Guyanese are Immigrants from Barbados (16.6%, a difference of 0.52%), Sioux (16.8%, a difference of 0.70%), Immigrants from Jamaica (16.9%, a difference of 0.98%), U.S. Virgin Islander (16.5%, a difference of 1.1%), and Immigrants from Guyana (16.9%, a difference of 1.2%).
| Demographics | Rating | Rank | Receiving Food Stamps |
| Nicaraguans | 0.0 /100 | #303 | Tragic 16.1% |
| West Indians | 0.0 /100 | #304 | Tragic 16.3% |
| Immigrants | Azores | 0.0 /100 | #305 | Tragic 16.4% |
| Jamaicans | 0.0 /100 | #306 | Tragic 16.4% |
| Houma | 0.0 /100 | #307 | Tragic 16.5% |
| Barbadians | 0.0 /100 | #308 | Tragic 16.5% |
| U.S. Virgin Islanders | 0.0 /100 | #309 | Tragic 16.5% |
| Immigrants | Barbados | 0.0 /100 | #310 | Tragic 16.6% |
| Guyanese | 0.0 /100 | #311 | Tragic 16.7% |
| Sioux | 0.0 /100 | #312 | Tragic 16.8% |
| Immigrants | Jamaica | 0.0 /100 | #313 | Tragic 16.9% |
| Immigrants | Guyana | 0.0 /100 | #314 | Tragic 16.9% |
| Bahamians | 0.0 /100 | #315 | Tragic 17.0% |
| Central American Indians | 0.0 /100 | #316 | Tragic 17.1% |
| Blacks/African Americans | 0.0 /100 | #317 | Tragic 17.2% |
| Menominee | 0.0 /100 | #318 | Tragic 17.2% |
| Immigrants | St. Vincent and the Grenadines | 0.0 /100 | #319 | Tragic 17.2% |
| Immigrants | Nicaragua | 0.0 /100 | #320 | Tragic 17.2% |
| Natives/Alaskans | 0.0 /100 | #321 | Tragic 17.3% |
| Immigrants | Grenada | 0.0 /100 | #322 | Tragic 17.8% |
| Haitians | 0.0 /100 | #323 | Tragic 17.8% |