Hopi vs Immigrants from Trinidad and Tobago Seniors Poverty Over the Age of 75
COMPARE
Hopi
Immigrants from Trinidad and Tobago
Seniors Poverty Over the Age of 75
Seniors Poverty Over the Age of 75 Comparison
Hopi
Immigrants from Trinidad and Tobago
18.9%
SENIORS POVERTY OVER THE AGE OF 75
0.0/ 100
METRIC RATING
339th/ 347
METRIC RANK
15.7%
SENIORS POVERTY OVER THE AGE OF 75
0.0/ 100
METRIC RATING
304th/ 347
METRIC RANK
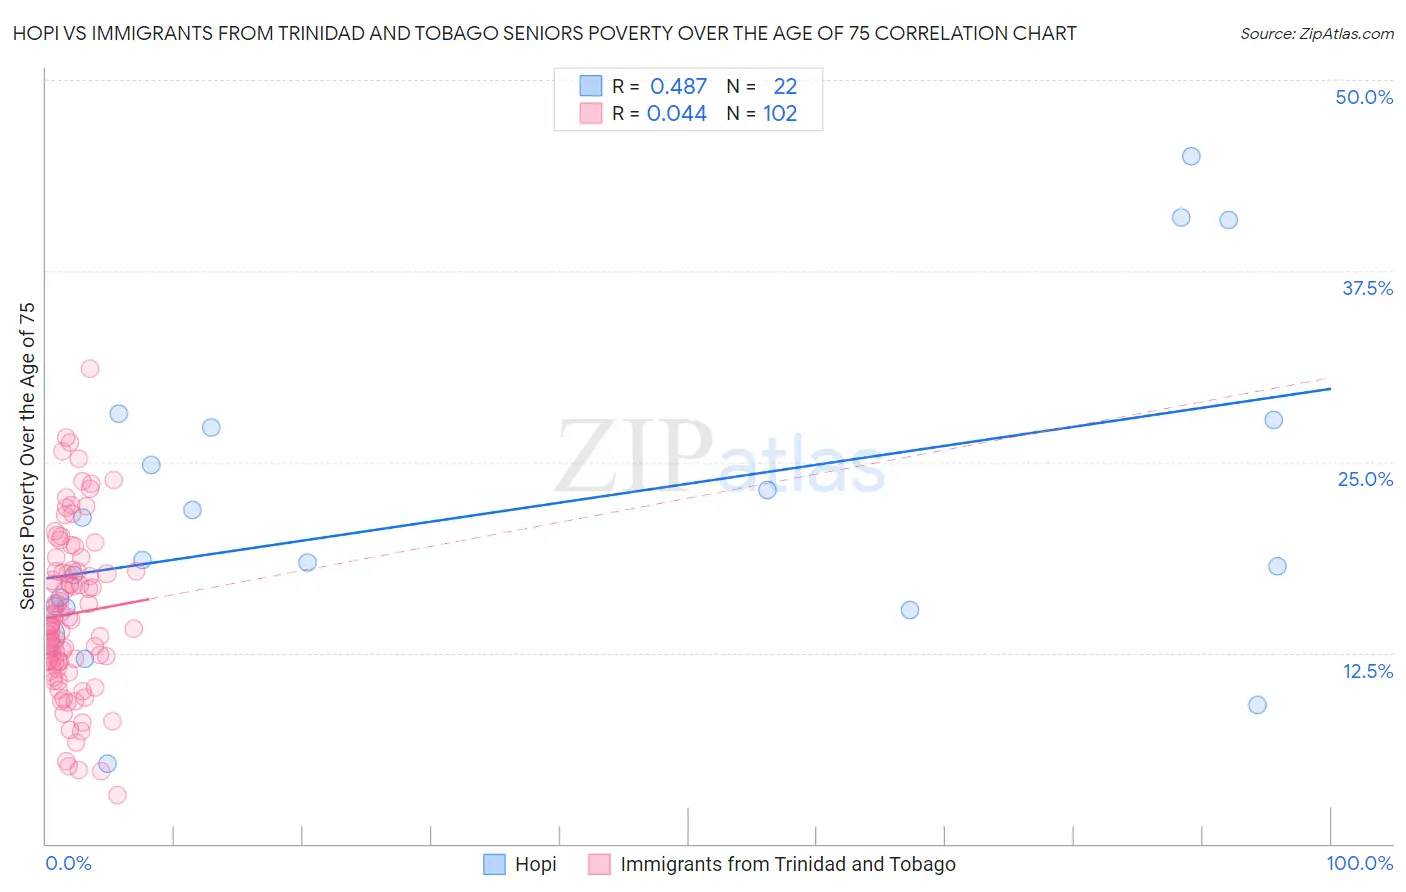
Hopi vs Immigrants from Trinidad and Tobago Seniors Poverty Over the Age of 75 Correlation Chart
The statistical analysis conducted on geographies consisting of 74,452,894 people shows a moderate positive correlation between the proportion of Hopi and poverty level among seniors over the age of 75 in the United States with a correlation coefficient (R) of 0.487 and weighted average of 18.9%. Similarly, the statistical analysis conducted on geographies consisting of 222,011,128 people shows no correlation between the proportion of Immigrants from Trinidad and Tobago and poverty level among seniors over the age of 75 in the United States with a correlation coefficient (R) of 0.044 and weighted average of 15.7%, a difference of 19.8%.
Seniors Poverty Over the Age of 75 Correlation Summary
| Measurement | Hopi | Immigrants from Trinidad and Tobago |
| Minimum | 5.3% | 3.2% |
| Maximum | 45.0% | 31.1% |
| Range | 39.7% | 27.9% |
| Mean | 21.7% | 15.1% |
| Median | 18.5% | 14.4% |
| Interquartile 25% (IQ1) | 15.4% | 11.9% |
| Interquartile 75% (IQ3) | 27.3% | 17.8% |
| Interquartile Range (IQR) | 11.8% | 5.9% |
| Standard Deviation (Sample) | 10.2% | 5.4% |
| Standard Deviation (Population) | 10.0% | 5.4% |
Similar Demographics by Seniors Poverty Over the Age of 75
Demographics Similar to Hopi by Seniors Poverty Over the Age of 75
In terms of seniors poverty over the age of 75, the demographic groups most similar to Hopi are Tohono O'odham (19.1%, a difference of 1.5%), Immigrants from Cabo Verde (18.5%, a difference of 2.0%), Navajo (19.4%, a difference of 2.8%), Yakama (18.3%, a difference of 2.9%), and Immigrants from Caribbean (18.2%, a difference of 3.4%).
| Demographics | Rating | Rank | Seniors Poverty Over the Age of 75 |
| Immigrants | St. Vincent and the Grenadines | 0.0 /100 | #332 | Tragic 17.5% |
| Immigrants | Nicaragua | 0.0 /100 | #333 | Tragic 17.6% |
| Immigrants | Grenada | 0.0 /100 | #334 | Tragic 17.8% |
| Cubans | 0.0 /100 | #335 | Tragic 18.0% |
| Immigrants | Caribbean | 0.0 /100 | #336 | Tragic 18.2% |
| Yakama | 0.0 /100 | #337 | Tragic 18.3% |
| Immigrants | Cabo Verde | 0.0 /100 | #338 | Tragic 18.5% |
| Hopi | 0.0 /100 | #339 | Tragic 18.9% |
| Tohono O'odham | 0.0 /100 | #340 | Tragic 19.1% |
| Navajo | 0.0 /100 | #341 | Tragic 19.4% |
| Dominicans | 0.0 /100 | #342 | Tragic 19.6% |
| Lumbee | 0.0 /100 | #343 | Tragic 19.7% |
| Immigrants | Cuba | 0.0 /100 | #344 | Tragic 19.9% |
| Immigrants | Dominican Republic | 0.0 /100 | #345 | Tragic 20.1% |
| Puerto Ricans | 0.0 /100 | #346 | Tragic 23.2% |
Demographics Similar to Immigrants from Trinidad and Tobago by Seniors Poverty Over the Age of 75
In terms of seniors poverty over the age of 75, the demographic groups most similar to Immigrants from Trinidad and Tobago are Ecuadorian (15.7%, a difference of 0.040%), Immigrants from Honduras (15.7%, a difference of 0.18%), Hispanic or Latino (15.8%, a difference of 0.20%), Immigrants from West Indies (15.8%, a difference of 0.34%), and West Indian (15.7%, a difference of 0.35%).
| Demographics | Rating | Rank | Seniors Poverty Over the Age of 75 |
| Hondurans | 0.0 /100 | #297 | Tragic 15.4% |
| Natives/Alaskans | 0.0 /100 | #298 | Tragic 15.5% |
| Spanish American Indians | 0.0 /100 | #299 | Tragic 15.5% |
| Bahamians | 0.0 /100 | #300 | Tragic 15.5% |
| Immigrants | Latin America | 0.0 /100 | #301 | Tragic 15.6% |
| West Indians | 0.0 /100 | #302 | Tragic 15.7% |
| Immigrants | Honduras | 0.0 /100 | #303 | Tragic 15.7% |
| Immigrants | Trinidad and Tobago | 0.0 /100 | #304 | Tragic 15.7% |
| Ecuadorians | 0.0 /100 | #305 | Tragic 15.7% |
| Hispanics or Latinos | 0.0 /100 | #306 | Tragic 15.8% |
| Immigrants | West Indies | 0.0 /100 | #307 | Tragic 15.8% |
| Immigrants | Bangladesh | 0.0 /100 | #308 | Tragic 15.8% |
| Yup'ik | 0.0 /100 | #309 | Tragic 15.8% |
| Vietnamese | 0.0 /100 | #310 | Tragic 15.9% |
| Trinidadians and Tobagonians | 0.0 /100 | #311 | Tragic 15.9% |