Immigrants from Caribbean vs Immigrants from Argentina Receiving Food Stamps
COMPARE
Immigrants from Caribbean
Immigrants from Argentina
Receiving Food Stamps
Receiving Food Stamps Comparison
Immigrants from Caribbean
Immigrants from Argentina
19.6%
RECEIVING FOOD STAMPS
0.0/ 100
METRIC RATING
331st/ 347
METRIC RANK
11.2%
RECEIVING FOOD STAMPS
80.4/ 100
METRIC RATING
155th/ 347
METRIC RANK
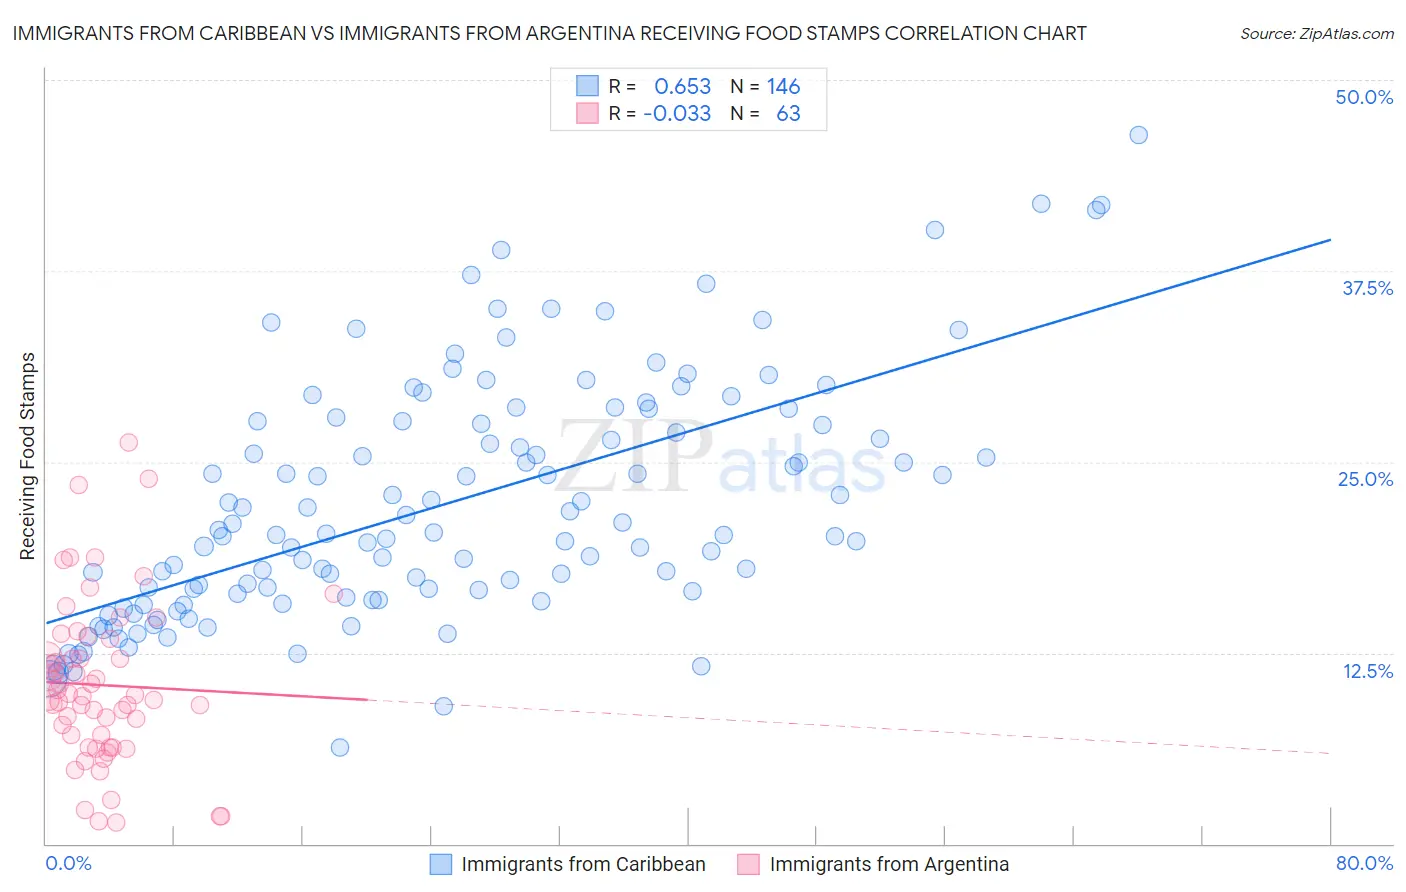
Immigrants from Caribbean vs Immigrants from Argentina Receiving Food Stamps Correlation Chart
The statistical analysis conducted on geographies consisting of 448,445,784 people shows a significant positive correlation between the proportion of Immigrants from Caribbean and percentage of population receiving government assistance and/or food stamps in the United States with a correlation coefficient (R) of 0.653 and weighted average of 19.6%. Similarly, the statistical analysis conducted on geographies consisting of 263,859,241 people shows no correlation between the proportion of Immigrants from Argentina and percentage of population receiving government assistance and/or food stamps in the United States with a correlation coefficient (R) of -0.033 and weighted average of 11.2%, a difference of 75.7%.
Receiving Food Stamps Correlation Summary
| Measurement | Immigrants from Caribbean | Immigrants from Argentina |
| Minimum | 6.3% | 1.4% |
| Maximum | 46.4% | 26.3% |
| Range | 40.1% | 24.9% |
| Mean | 22.2% | 10.4% |
| Median | 20.3% | 9.6% |
| Interquartile 25% (IQ1) | 16.1% | 6.3% |
| Interquartile 75% (IQ3) | 27.7% | 13.4% |
| Interquartile Range (IQR) | 11.5% | 7.1% |
| Standard Deviation (Sample) | 7.8% | 5.3% |
| Standard Deviation (Population) | 7.8% | 5.3% |
Similar Demographics by Receiving Food Stamps
Demographics Similar to Immigrants from Caribbean by Receiving Food Stamps
In terms of receiving food stamps, the demographic groups most similar to Immigrants from Caribbean are Pueblo (19.9%, a difference of 1.5%), Inupiat (20.1%, a difference of 2.2%), Yuman (20.2%, a difference of 3.1%), Pima (19.0%, a difference of 3.4%), and Immigrants from Cuba (20.8%, a difference of 6.2%).
| Demographics | Rating | Rank | Receiving Food Stamps |
| British West Indians | 0.0 /100 | #324 | Tragic 17.9% |
| Immigrants | Haiti | 0.0 /100 | #325 | Tragic 18.2% |
| Cubans | 0.0 /100 | #326 | Tragic 18.2% |
| Apache | 0.0 /100 | #327 | Tragic 18.3% |
| Colville | 0.0 /100 | #328 | Tragic 18.3% |
| Immigrants | Dominica | 0.0 /100 | #329 | Tragic 18.4% |
| Pima | 0.0 /100 | #330 | Tragic 19.0% |
| Immigrants | Caribbean | 0.0 /100 | #331 | Tragic 19.6% |
| Pueblo | 0.0 /100 | #332 | Tragic 19.9% |
| Inupiat | 0.0 /100 | #333 | Tragic 20.1% |
| Yuman | 0.0 /100 | #334 | Tragic 20.2% |
| Immigrants | Cuba | 0.0 /100 | #335 | Tragic 20.8% |
| Navajo | 0.0 /100 | #336 | Tragic 21.1% |
| Cape Verdeans | 0.0 /100 | #337 | Tragic 21.1% |
| Dominicans | 0.0 /100 | #338 | Tragic 21.4% |
Demographics Similar to Immigrants from Argentina by Receiving Food Stamps
In terms of receiving food stamps, the demographic groups most similar to Immigrants from Argentina are Armenian (11.1%, a difference of 0.25%), Lebanese (11.1%, a difference of 0.31%), Immigrants from Spain (11.1%, a difference of 0.33%), Immigrants from Kazakhstan (11.1%, a difference of 0.33%), and Soviet Union (11.1%, a difference of 0.69%).
| Demographics | Rating | Rank | Receiving Food Stamps |
| Immigrants | South Eastern Asia | 83.3 /100 | #148 | Excellent 11.1% |
| Brazilians | 83.2 /100 | #149 | Excellent 11.1% |
| Soviet Union | 83.1 /100 | #150 | Excellent 11.1% |
| Immigrants | Spain | 81.7 /100 | #151 | Excellent 11.1% |
| Immigrants | Kazakhstan | 81.7 /100 | #152 | Excellent 11.1% |
| Lebanese | 81.6 /100 | #153 | Excellent 11.1% |
| Armenians | 81.4 /100 | #154 | Excellent 11.1% |
| Immigrants | Argentina | 80.4 /100 | #155 | Excellent 11.2% |
| Immigrants | Afghanistan | 75.6 /100 | #156 | Good 11.3% |
| Immigrants | Lebanon | 75.2 /100 | #157 | Good 11.3% |
| Immigrants | Bosnia and Herzegovina | 72.6 /100 | #158 | Good 11.3% |
| Immigrants | Oceania | 70.4 /100 | #159 | Good 11.4% |
| French Canadians | 69.5 /100 | #160 | Good 11.4% |
| Pennsylvania Germans | 68.4 /100 | #161 | Good 11.4% |
| Alsatians | 68.0 /100 | #162 | Good 11.4% |