Central American Indian vs French Child Poverty Among Girls Under 16
COMPARE
Central American Indian
French
Child Poverty Among Girls Under 16
Child Poverty Among Girls Under 16 Comparison
Central American Indians
French
22.8%
CHILD POVERTY AMONG GIRLS UNDER 16
0.0/ 100
METRIC RATING
327th/ 347
METRIC RANK
16.0%
CHILD POVERTY AMONG GIRLS UNDER 16
72.8/ 100
METRIC RATING
160th/ 347
METRIC RANK
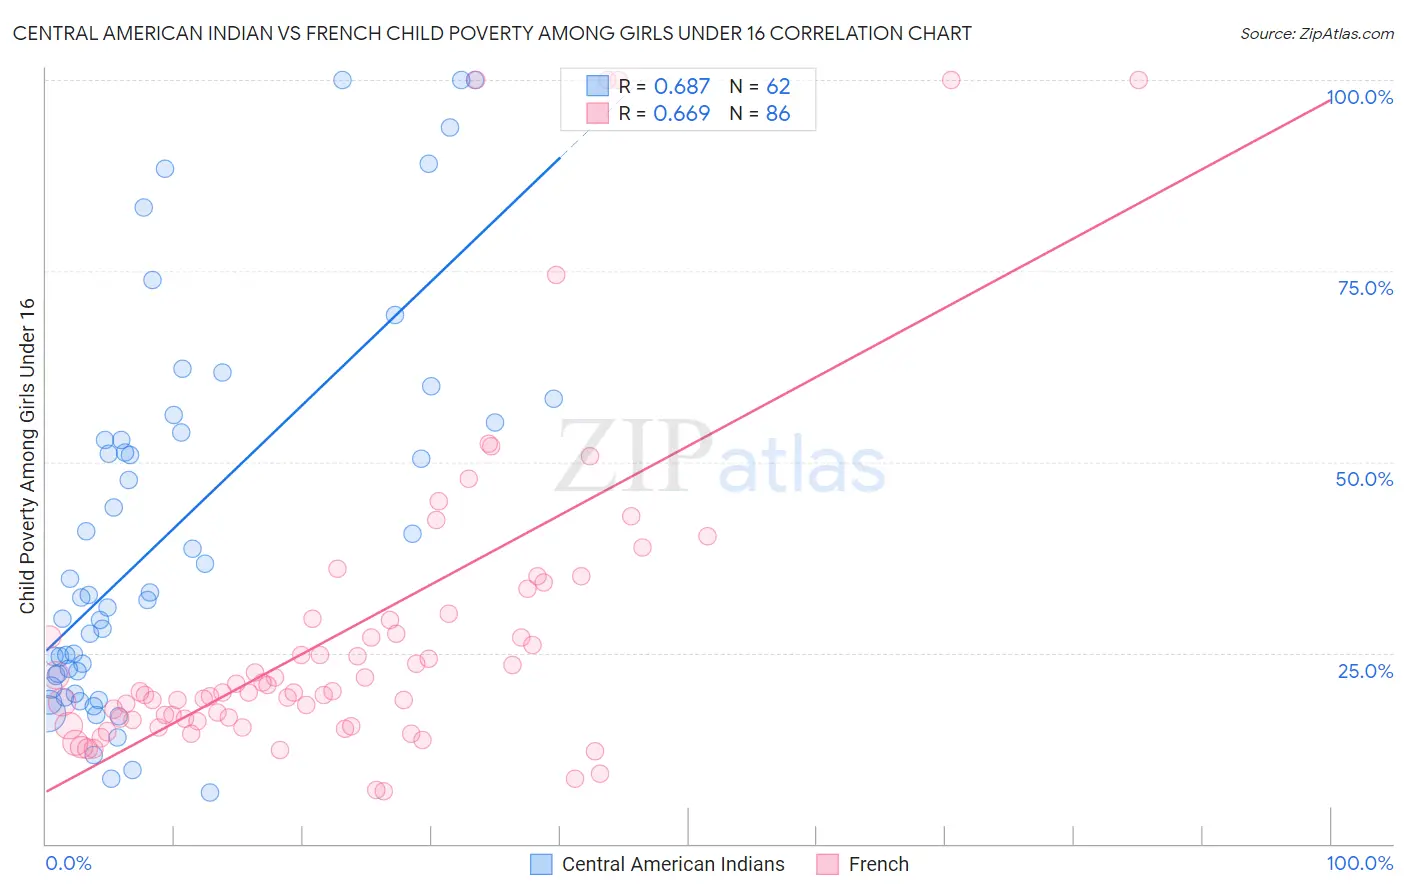
Central American Indian vs French Child Poverty Among Girls Under 16 Correlation Chart
The statistical analysis conducted on geographies consisting of 323,193,354 people shows a significant positive correlation between the proportion of Central American Indians and poverty level among girls under the age of 16 in the United States with a correlation coefficient (R) of 0.687 and weighted average of 22.8%. Similarly, the statistical analysis conducted on geographies consisting of 549,650,331 people shows a significant positive correlation between the proportion of French and poverty level among girls under the age of 16 in the United States with a correlation coefficient (R) of 0.669 and weighted average of 16.0%, a difference of 42.5%.
Child Poverty Among Girls Under 16 Correlation Summary
| Measurement | Central American Indian | French |
| Minimum | 6.7% | 6.8% |
| Maximum | 100.0% | 100.0% |
| Range | 93.3% | 93.2% |
| Mean | 40.6% | 27.8% |
| Median | 32.4% | 19.9% |
| Interquartile 25% (IQ1) | 22.0% | 16.2% |
| Interquartile 75% (IQ3) | 53.8% | 29.5% |
| Interquartile Range (IQR) | 31.8% | 13.3% |
| Standard Deviation (Sample) | 25.0% | 21.4% |
| Standard Deviation (Population) | 24.8% | 21.3% |
Similar Demographics by Child Poverty Among Girls Under 16
Demographics Similar to Central American Indians by Child Poverty Among Girls Under 16
In terms of child poverty among girls under 16, the demographic groups most similar to Central American Indians are Immigrants from Honduras (22.8%, a difference of 0.14%), Immigrants from Congo (22.7%, a difference of 0.27%), Paiute (22.6%, a difference of 0.77%), Cajun (22.6%, a difference of 1.1%), and Yakama (22.6%, a difference of 1.1%).
| Demographics | Rating | Rank | Child Poverty Among Girls Under 16 |
| Hondurans | 0.0 /100 | #320 | Tragic 22.2% |
| Colville | 0.0 /100 | #321 | Tragic 22.5% |
| Yakama | 0.0 /100 | #322 | Tragic 22.6% |
| Cajuns | 0.0 /100 | #323 | Tragic 22.6% |
| Paiute | 0.0 /100 | #324 | Tragic 22.6% |
| Immigrants | Congo | 0.0 /100 | #325 | Tragic 22.7% |
| Immigrants | Honduras | 0.0 /100 | #326 | Tragic 22.8% |
| Central American Indians | 0.0 /100 | #327 | Tragic 22.8% |
| Dominicans | 0.0 /100 | #328 | Tragic 23.7% |
| Kiowa | 0.0 /100 | #329 | Tragic 23.7% |
| Immigrants | Dominican Republic | 0.0 /100 | #330 | Tragic 23.8% |
| Apache | 0.0 /100 | #331 | Tragic 23.8% |
| Natives/Alaskans | 0.0 /100 | #332 | Tragic 24.0% |
| Blacks/African Americans | 0.0 /100 | #333 | Tragic 24.7% |
| Menominee | 0.0 /100 | #334 | Tragic 25.0% |
Demographics Similar to French by Child Poverty Among Girls Under 16
In terms of child poverty among girls under 16, the demographic groups most similar to French are Immigrants from Northern Africa (16.0%, a difference of 0.11%), Slovak (15.9%, a difference of 0.38%), Guamanian/Chamorro (15.9%, a difference of 0.40%), Immigrants from Fiji (15.9%, a difference of 0.52%), and Colombian (15.9%, a difference of 0.52%).
| Demographics | Rating | Rank | Child Poverty Among Girls Under 16 |
| Immigrants | Nepal | 78.5 /100 | #153 | Good 15.9% |
| Immigrants | Chile | 76.7 /100 | #154 | Good 15.9% |
| Syrians | 76.7 /100 | #155 | Good 15.9% |
| Immigrants | Fiji | 76.1 /100 | #156 | Good 15.9% |
| Colombians | 76.1 /100 | #157 | Good 15.9% |
| Guamanians/Chamorros | 75.3 /100 | #158 | Good 15.9% |
| Slovaks | 75.2 /100 | #159 | Good 15.9% |
| French | 72.8 /100 | #160 | Good 16.0% |
| Immigrants | Northern Africa | 72.0 /100 | #161 | Good 16.0% |
| French Canadians | 68.7 /100 | #162 | Good 16.1% |
| Immigrants | Oceania | 68.4 /100 | #163 | Good 16.1% |
| Immigrants | Colombia | 67.8 /100 | #164 | Good 16.1% |
| Immigrants | Germany | 67.3 /100 | #165 | Good 16.1% |
| South Americans | 67.2 /100 | #166 | Good 16.1% |
| Uruguayans | 64.7 /100 | #167 | Good 16.2% |