Croatian vs French Child Poverty Among Girls Under 16
COMPARE
Croatian
French
Child Poverty Among Girls Under 16
Child Poverty Among Girls Under 16 Comparison
Croatians
French
14.1%
CHILD POVERTY AMONG GIRLS UNDER 16
99.3/ 100
METRIC RATING
46th/ 347
METRIC RANK
16.0%
CHILD POVERTY AMONG GIRLS UNDER 16
72.8/ 100
METRIC RATING
160th/ 347
METRIC RANK
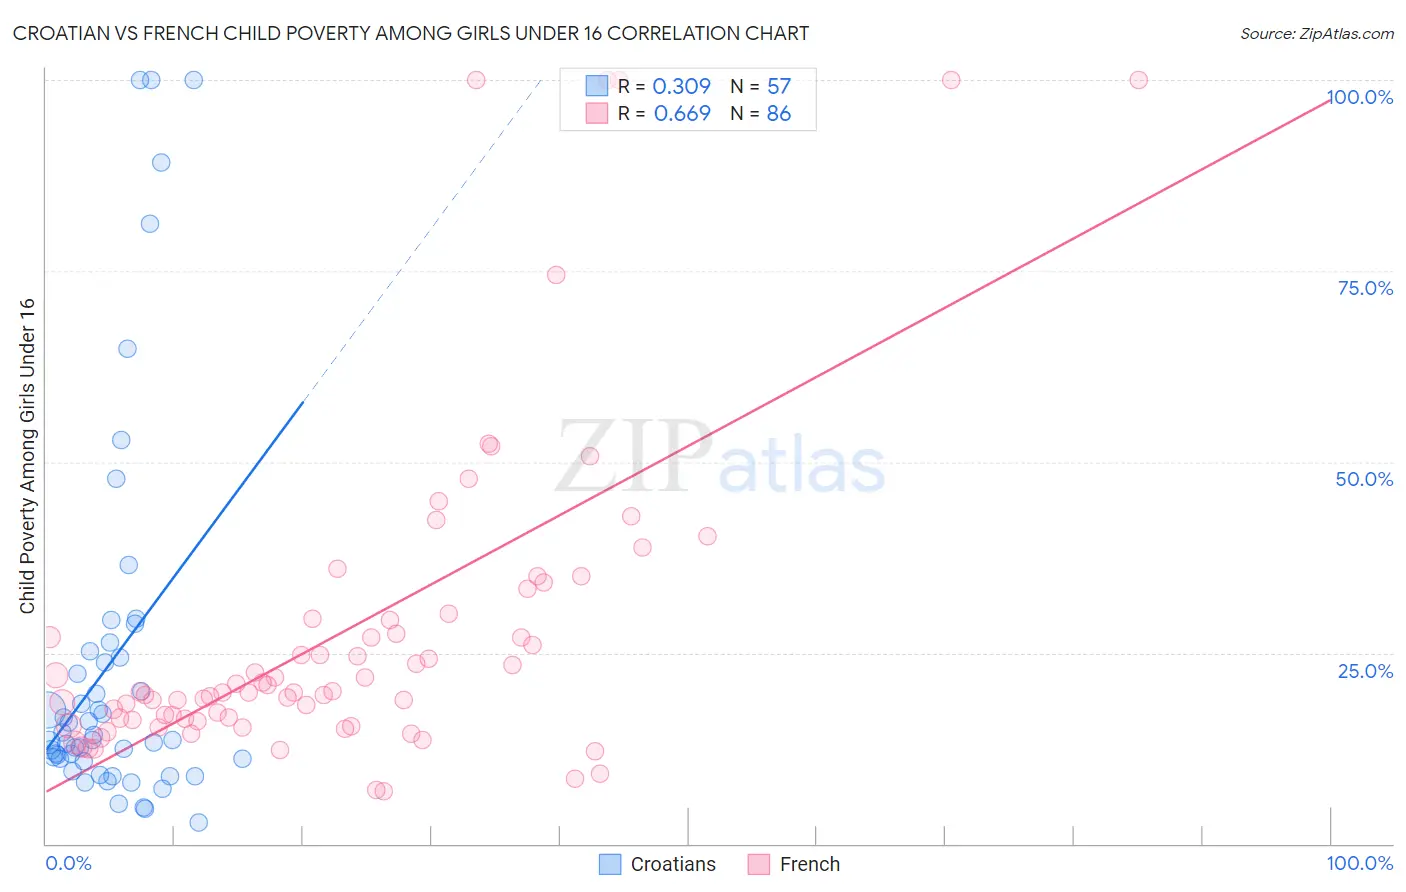
Croatian vs French Child Poverty Among Girls Under 16 Correlation Chart
The statistical analysis conducted on geographies consisting of 367,548,262 people shows a mild positive correlation between the proportion of Croatians and poverty level among girls under the age of 16 in the United States with a correlation coefficient (R) of 0.309 and weighted average of 14.1%. Similarly, the statistical analysis conducted on geographies consisting of 549,650,331 people shows a significant positive correlation between the proportion of French and poverty level among girls under the age of 16 in the United States with a correlation coefficient (R) of 0.669 and weighted average of 16.0%, a difference of 13.1%.
Child Poverty Among Girls Under 16 Correlation Summary
| Measurement | Croatian | French |
| Minimum | 2.8% | 6.8% |
| Maximum | 100.0% | 100.0% |
| Range | 97.2% | 93.2% |
| Mean | 23.8% | 27.8% |
| Median | 13.6% | 19.9% |
| Interquartile 25% (IQ1) | 10.9% | 16.2% |
| Interquartile 75% (IQ3) | 24.8% | 29.5% |
| Interquartile Range (IQR) | 13.9% | 13.3% |
| Standard Deviation (Sample) | 24.9% | 21.4% |
| Standard Deviation (Population) | 24.7% | 21.3% |
Similar Demographics by Child Poverty Among Girls Under 16
Demographics Similar to Croatians by Child Poverty Among Girls Under 16
In terms of child poverty among girls under 16, the demographic groups most similar to Croatians are Immigrants from Greece (14.1%, a difference of 0.030%), Immigrants from Czechoslovakia (14.2%, a difference of 0.030%), Czech (14.2%, a difference of 0.040%), Greek (14.2%, a difference of 0.080%), and Immigrants from Israel (14.2%, a difference of 0.15%).
| Demographics | Rating | Rank | Child Poverty Among Girls Under 16 |
| Immigrants | Australia | 99.5 /100 | #39 | Exceptional 14.0% |
| Immigrants | Sri Lanka | 99.5 /100 | #40 | Exceptional 14.0% |
| Immigrants | Bolivia | 99.5 /100 | #41 | Exceptional 14.0% |
| Immigrants | Scotland | 99.4 /100 | #42 | Exceptional 14.0% |
| Koreans | 99.4 /100 | #43 | Exceptional 14.1% |
| Immigrants | Asia | 99.4 /100 | #44 | Exceptional 14.1% |
| Immigrants | Greece | 99.3 /100 | #45 | Exceptional 14.1% |
| Croatians | 99.3 /100 | #46 | Exceptional 14.1% |
| Immigrants | Czechoslovakia | 99.3 /100 | #47 | Exceptional 14.2% |
| Czechs | 99.3 /100 | #48 | Exceptional 14.2% |
| Greeks | 99.2 /100 | #49 | Exceptional 14.2% |
| Immigrants | Israel | 99.2 /100 | #50 | Exceptional 14.2% |
| Immigrants | Pakistan | 99.1 /100 | #51 | Exceptional 14.2% |
| Italians | 99.1 /100 | #52 | Exceptional 14.3% |
| Luxembourgers | 99.0 /100 | #53 | Exceptional 14.3% |
Demographics Similar to French by Child Poverty Among Girls Under 16
In terms of child poverty among girls under 16, the demographic groups most similar to French are Immigrants from Northern Africa (16.0%, a difference of 0.11%), Slovak (15.9%, a difference of 0.38%), Guamanian/Chamorro (15.9%, a difference of 0.40%), Immigrants from Fiji (15.9%, a difference of 0.52%), and Colombian (15.9%, a difference of 0.52%).
| Demographics | Rating | Rank | Child Poverty Among Girls Under 16 |
| Immigrants | Nepal | 78.5 /100 | #153 | Good 15.9% |
| Immigrants | Chile | 76.7 /100 | #154 | Good 15.9% |
| Syrians | 76.7 /100 | #155 | Good 15.9% |
| Immigrants | Fiji | 76.1 /100 | #156 | Good 15.9% |
| Colombians | 76.1 /100 | #157 | Good 15.9% |
| Guamanians/Chamorros | 75.3 /100 | #158 | Good 15.9% |
| Slovaks | 75.2 /100 | #159 | Good 15.9% |
| French | 72.8 /100 | #160 | Good 16.0% |
| Immigrants | Northern Africa | 72.0 /100 | #161 | Good 16.0% |
| French Canadians | 68.7 /100 | #162 | Good 16.1% |
| Immigrants | Oceania | 68.4 /100 | #163 | Good 16.1% |
| Immigrants | Colombia | 67.8 /100 | #164 | Good 16.1% |
| Immigrants | Germany | 67.3 /100 | #165 | Good 16.1% |
| South Americans | 67.2 /100 | #166 | Good 16.1% |
| Uruguayans | 64.7 /100 | #167 | Good 16.2% |