Celtic vs Immigrants from Micronesia Child Poverty Under the Age of 5
COMPARE
Celtic
Immigrants from Micronesia
Child Poverty Under the Age of 5
Child Poverty Under the Age of 5 Comparison
Celtics
Immigrants from Micronesia
17.9%
CHILD POVERTY UNDER THE AGE OF 5
18.3/ 100
METRIC RATING
198th/ 347
METRIC RANK
19.4%
CHILD POVERTY UNDER THE AGE OF 5
0.9/ 100
METRIC RATING
234th/ 347
METRIC RANK
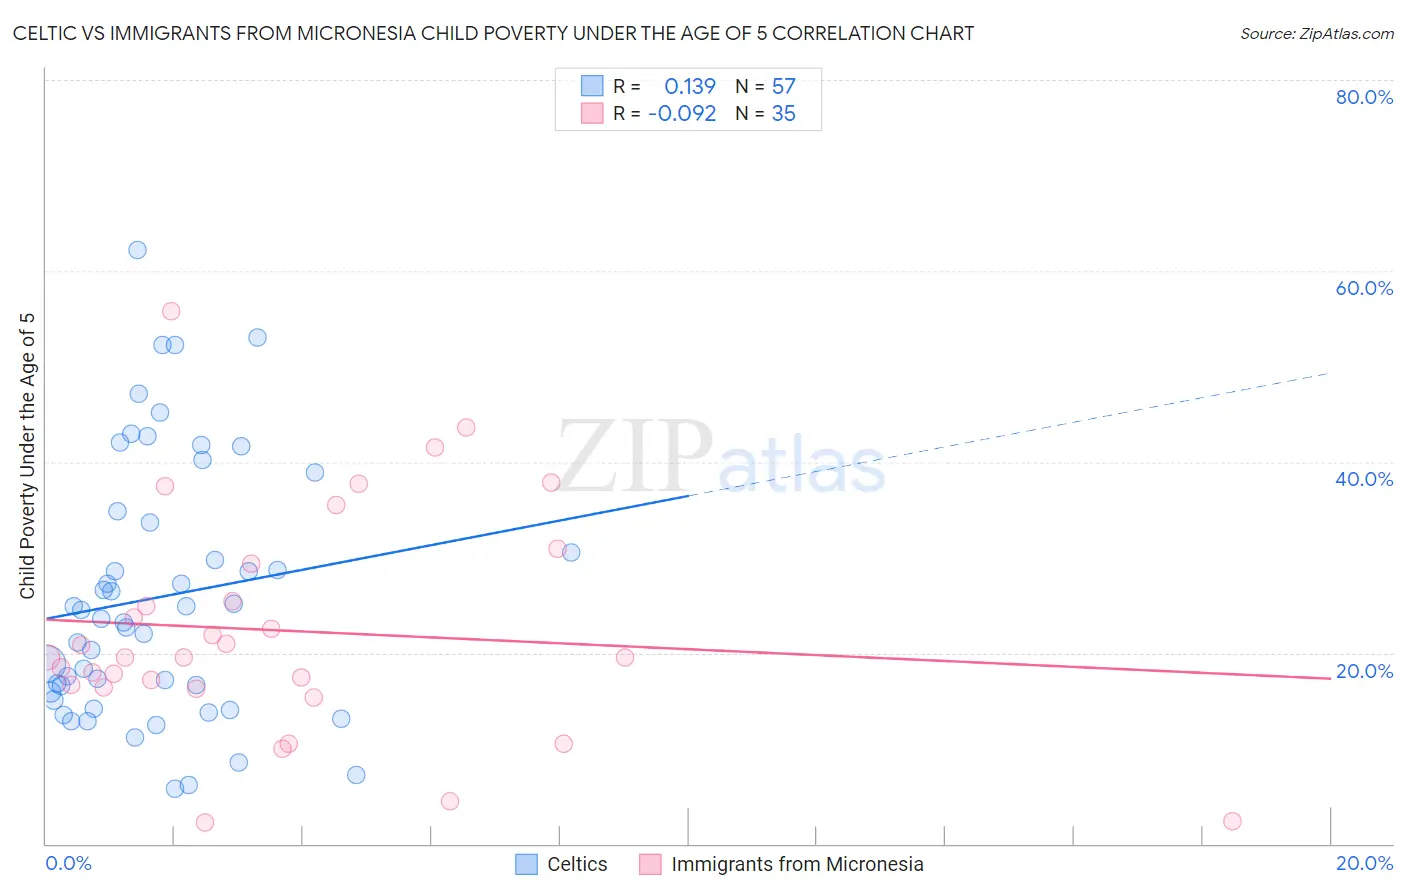
Celtic vs Immigrants from Micronesia Child Poverty Under the Age of 5 Correlation Chart
The statistical analysis conducted on geographies consisting of 165,160,308 people shows a poor positive correlation between the proportion of Celtics and poverty level among children under the age of 5 in the United States with a correlation coefficient (R) of 0.139 and weighted average of 17.9%. Similarly, the statistical analysis conducted on geographies consisting of 61,294,346 people shows a slight negative correlation between the proportion of Immigrants from Micronesia and poverty level among children under the age of 5 in the United States with a correlation coefficient (R) of -0.092 and weighted average of 19.4%, a difference of 8.1%.
Child Poverty Under the Age of 5 Correlation Summary
| Measurement | Celtic | Immigrants from Micronesia |
| Minimum | 5.7% | 2.3% |
| Maximum | 62.3% | 55.8% |
| Range | 56.5% | 53.5% |
| Mean | 25.8% | 22.3% |
| Median | 23.6% | 19.5% |
| Interquartile 25% (IQ1) | 15.5% | 16.4% |
| Interquartile 75% (IQ3) | 34.3% | 29.4% |
| Interquartile Range (IQR) | 18.8% | 12.9% |
| Standard Deviation (Sample) | 13.4% | 11.9% |
| Standard Deviation (Population) | 13.3% | 11.7% |
Similar Demographics by Child Poverty Under the Age of 5
Demographics Similar to Celtics by Child Poverty Under the Age of 5
In terms of child poverty under the age of 5, the demographic groups most similar to Celtics are Hungarian (17.9%, a difference of 0.010%), Immigrants from Kenya (17.9%, a difference of 0.28%), Immigrants from Portugal (17.8%, a difference of 0.60%), Iraqi (18.0%, a difference of 0.81%), and Ugandan (18.0%, a difference of 0.82%).
| Demographics | Rating | Rank | Child Poverty Under the Age of 5 |
| Immigrants | Afghanistan | 27.9 /100 | #191 | Fair 17.7% |
| Immigrants | Uruguay | 27.8 /100 | #192 | Fair 17.7% |
| Immigrants | Uganda | 25.0 /100 | #193 | Fair 17.7% |
| French Canadians | 24.6 /100 | #194 | Fair 17.7% |
| Sierra Leoneans | 24.1 /100 | #195 | Fair 17.7% |
| Immigrants | Portugal | 22.2 /100 | #196 | Fair 17.8% |
| Immigrants | Kenya | 20.0 /100 | #197 | Fair 17.9% |
| Celtics | 18.3 /100 | #198 | Poor 17.9% |
| Hungarians | 18.3 /100 | #199 | Poor 17.9% |
| Iraqis | 14.0 /100 | #200 | Poor 18.0% |
| Ugandans | 13.9 /100 | #201 | Poor 18.0% |
| Japanese | 13.8 /100 | #202 | Poor 18.1% |
| Immigrants | Cambodia | 13.7 /100 | #203 | Poor 18.1% |
| Immigrants | Eastern Africa | 13.4 /100 | #204 | Poor 18.1% |
| Spaniards | 12.8 /100 | #205 | Poor 18.1% |
Demographics Similar to Immigrants from Micronesia by Child Poverty Under the Age of 5
In terms of child poverty under the age of 5, the demographic groups most similar to Immigrants from Micronesia are Sudanese (19.3%, a difference of 0.12%), Trinidadian and Tobagonian (19.3%, a difference of 0.18%), Immigrants from Laos (19.4%, a difference of 0.21%), Immigrants from Trinidad and Tobago (19.4%, a difference of 0.21%), and Bermudan (19.2%, a difference of 0.74%).
| Demographics | Rating | Rank | Child Poverty Under the Age of 5 |
| Cape Verdeans | 1.4 /100 | #227 | Tragic 19.1% |
| Immigrants | Sudan | 1.3 /100 | #228 | Tragic 19.2% |
| Ghanaians | 1.2 /100 | #229 | Tragic 19.2% |
| Ecuadorians | 1.2 /100 | #230 | Tragic 19.2% |
| Bermudans | 1.2 /100 | #231 | Tragic 19.2% |
| Trinidadians and Tobagonians | 0.9 /100 | #232 | Tragic 19.3% |
| Sudanese | 0.9 /100 | #233 | Tragic 19.3% |
| Immigrants | Micronesia | 0.9 /100 | #234 | Tragic 19.4% |
| Immigrants | Laos | 0.8 /100 | #235 | Tragic 19.4% |
| Immigrants | Trinidad and Tobago | 0.8 /100 | #236 | Tragic 19.4% |
| Immigrants | Cabo Verde | 0.6 /100 | #237 | Tragic 19.5% |
| Salvadorans | 0.6 /100 | #238 | Tragic 19.5% |
| Vietnamese | 0.6 /100 | #239 | Tragic 19.5% |
| Immigrants | Ecuador | 0.5 /100 | #240 | Tragic 19.6% |
| Alaska Natives | 0.5 /100 | #241 | Tragic 19.6% |