Carpatho Rusyn vs Tsimshian Single Father Poverty
COMPARE
Carpatho Rusyn
Tsimshian
Single Father Poverty
Single Father Poverty Comparison
Carpatho Rusyns
Tsimshian
18.0%
SINGLE FATHER POVERTY
0.0/ 100
METRIC RATING
287th/ 347
METRIC RANK
12.7%
SINGLE FATHER POVERTY
100.0/ 100
METRIC RATING
3rd/ 347
METRIC RANK
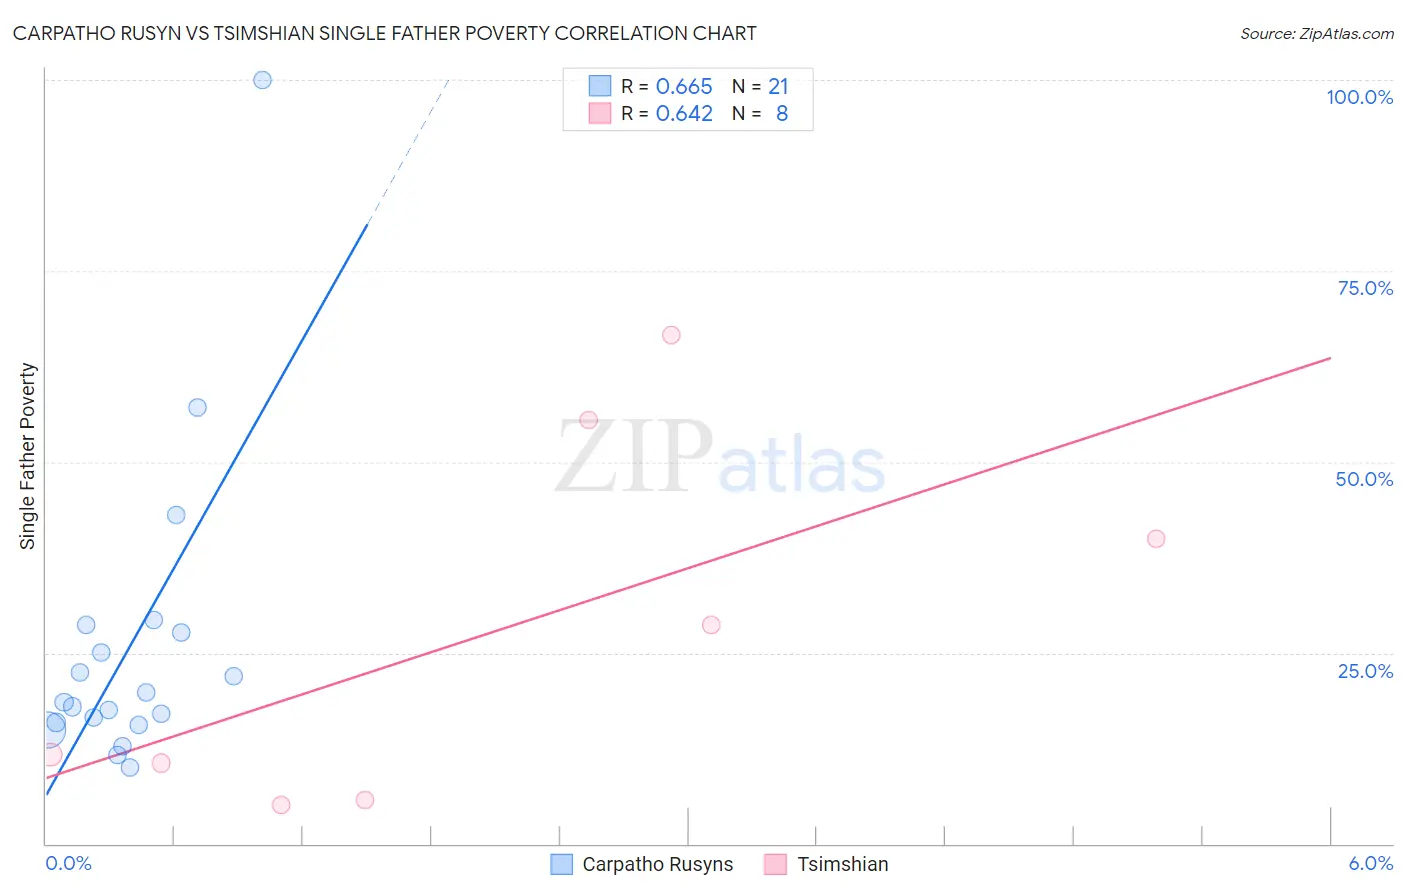
Carpatho Rusyn vs Tsimshian Single Father Poverty Correlation Chart
The statistical analysis conducted on geographies consisting of 53,631,013 people shows a significant positive correlation between the proportion of Carpatho Rusyns and poverty level among single fathers in the United States with a correlation coefficient (R) of 0.665 and weighted average of 18.0%. Similarly, the statistical analysis conducted on geographies consisting of 14,553,815 people shows a significant positive correlation between the proportion of Tsimshian and poverty level among single fathers in the United States with a correlation coefficient (R) of 0.642 and weighted average of 12.7%, a difference of 41.4%.
Single Father Poverty Correlation Summary
| Measurement | Carpatho Rusyn | Tsimshian |
| Minimum | 10.0% | 5.1% |
| Maximum | 100.0% | 66.7% |
| Range | 90.0% | 61.5% |
| Mean | 25.9% | 28.0% |
| Median | 18.6% | 20.1% |
| Interquartile 25% (IQ1) | 15.7% | 8.1% |
| Interquartile 75% (IQ3) | 28.1% | 47.7% |
| Interquartile Range (IQR) | 12.4% | 39.6% |
| Standard Deviation (Sample) | 20.2% | 23.9% |
| Standard Deviation (Population) | 19.7% | 22.3% |
Similar Demographics by Single Father Poverty
Demographics Similar to Carpatho Rusyns by Single Father Poverty
In terms of single father poverty, the demographic groups most similar to Carpatho Rusyns are Bahamian (18.0%, a difference of 0.020%), Immigrants from North Macedonia (17.9%, a difference of 0.22%), Immigrants from Lebanon (17.9%, a difference of 0.40%), Irish (18.0%, a difference of 0.46%), and West Indian (18.0%, a difference of 0.49%).
| Demographics | Rating | Rank | Single Father Poverty |
| Scottish | 0.0 /100 | #280 | Tragic 17.7% |
| English | 0.0 /100 | #281 | Tragic 17.8% |
| Dutch | 0.0 /100 | #282 | Tragic 17.8% |
| Alsatians | 0.0 /100 | #283 | Tragic 17.8% |
| Welsh | 0.0 /100 | #284 | Tragic 17.8% |
| Immigrants | Lebanon | 0.0 /100 | #285 | Tragic 17.9% |
| Immigrants | North Macedonia | 0.0 /100 | #286 | Tragic 17.9% |
| Carpatho Rusyns | 0.0 /100 | #287 | Tragic 18.0% |
| Bahamians | 0.0 /100 | #288 | Tragic 18.0% |
| Irish | 0.0 /100 | #289 | Tragic 18.0% |
| West Indians | 0.0 /100 | #290 | Tragic 18.0% |
| Alaskan Athabascans | 0.0 /100 | #291 | Tragic 18.1% |
| Immigrants | Bahamas | 0.0 /100 | #292 | Tragic 18.1% |
| Alaska Natives | 0.0 /100 | #293 | Tragic 18.1% |
| U.S. Virgin Islanders | 0.0 /100 | #294 | Tragic 18.1% |
Demographics Similar to Tsimshian by Single Father Poverty
In terms of single father poverty, the demographic groups most similar to Tsimshian are Tongan (12.2%, a difference of 3.9%), Immigrants from Fiji (13.2%, a difference of 4.2%), Immigrants from Ethiopia (13.4%, a difference of 5.9%), Ethiopian (13.5%, a difference of 6.7%), and Immigrants from Taiwan (13.7%, a difference of 7.8%).
| Demographics | Rating | Rank | Single Father Poverty |
| Assyrians/Chaldeans/Syriacs | 100.0 /100 | #1 | Exceptional 11.7% |
| Tongans | 100.0 /100 | #2 | Exceptional 12.2% |
| Tsimshian | 100.0 /100 | #3 | Exceptional 12.7% |
| Immigrants | Fiji | 100.0 /100 | #4 | Exceptional 13.2% |
| Immigrants | Ethiopia | 100.0 /100 | #5 | Exceptional 13.4% |
| Ethiopians | 100.0 /100 | #6 | Exceptional 13.5% |
| Immigrants | Taiwan | 100.0 /100 | #7 | Exceptional 13.7% |
| Samoans | 100.0 /100 | #8 | Exceptional 13.8% |
| Afghans | 100.0 /100 | #9 | Exceptional 14.0% |
| Koreans | 100.0 /100 | #10 | Exceptional 14.0% |
| Filipinos | 100.0 /100 | #11 | Exceptional 14.0% |
| Immigrants | India | 100.0 /100 | #12 | Exceptional 14.0% |
| Immigrants | Philippines | 100.0 /100 | #13 | Exceptional 14.0% |
| Immigrants | Vietnam | 100.0 /100 | #14 | Exceptional 14.1% |
| Sri Lankans | 100.0 /100 | #15 | Exceptional 14.2% |