Carpatho Rusyn vs Colombian Unemployment Among Ages 30 to 34 years
COMPARE
Carpatho Rusyn
Colombian
Unemployment Among Ages 30 to 34 years
Unemployment Among Ages 30 to 34 years Comparison
Carpatho Rusyns
Colombians
5.3%
UNEMPLOYMENT AMONG AGES 30 TO 34 YEARS
77.3/ 100
METRIC RATING
132nd/ 347
METRIC RANK
5.4%
UNEMPLOYMENT AMONG AGES 30 TO 34 YEARS
68.7/ 100
METRIC RATING
150th/ 347
METRIC RANK
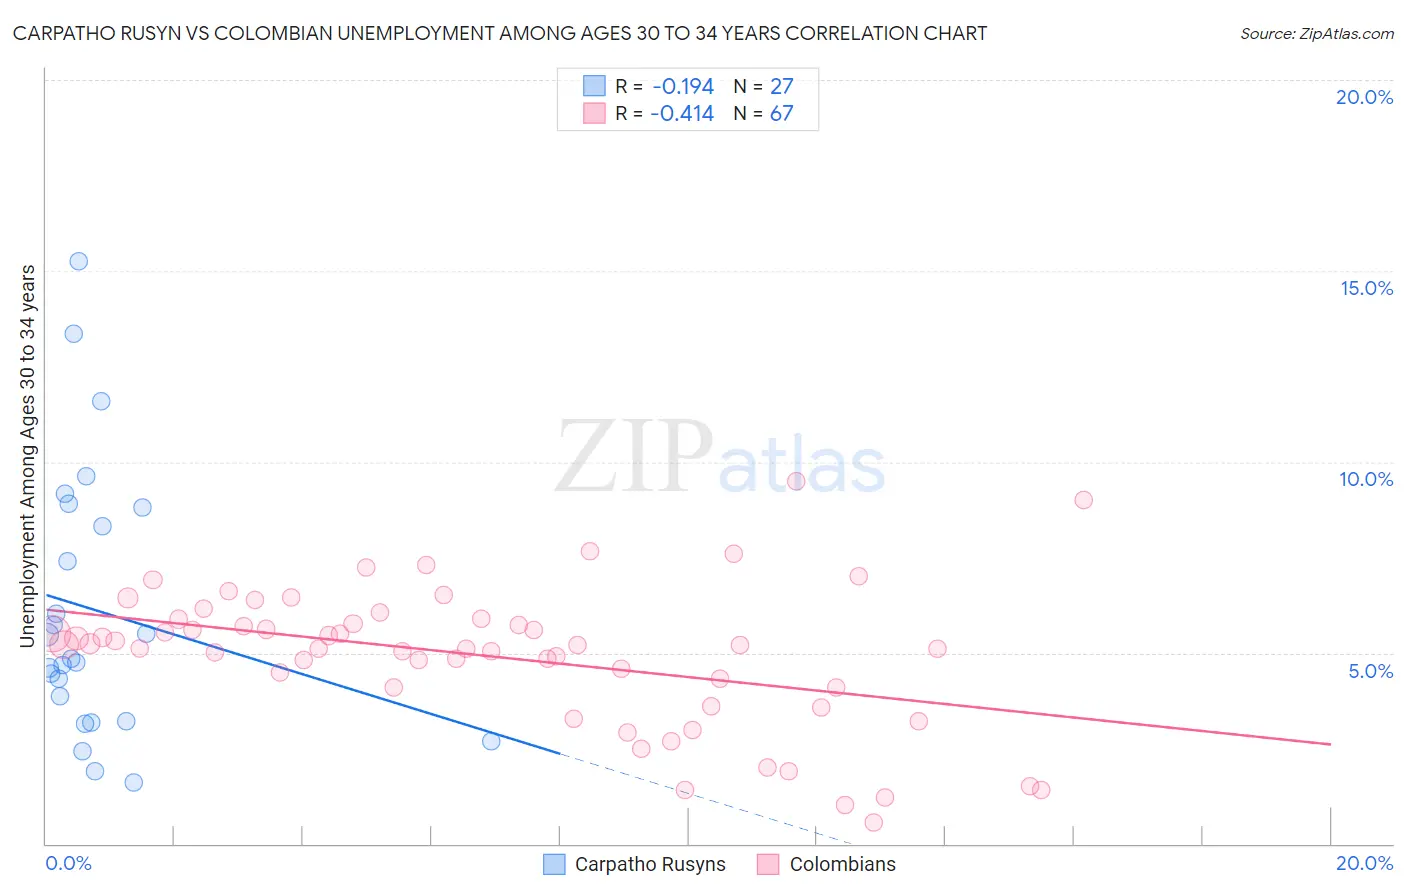
Carpatho Rusyn vs Colombian Unemployment Among Ages 30 to 34 years Correlation Chart
The statistical analysis conducted on geographies consisting of 57,625,902 people shows a poor negative correlation between the proportion of Carpatho Rusyns and unemployment rate among population between the ages 30 and 34 in the United States with a correlation coefficient (R) of -0.194 and weighted average of 5.3%. Similarly, the statistical analysis conducted on geographies consisting of 395,074,918 people shows a moderate negative correlation between the proportion of Colombians and unemployment rate among population between the ages 30 and 34 in the United States with a correlation coefficient (R) of -0.414 and weighted average of 5.4%, a difference of 0.78%.
Unemployment Among Ages 30 to 34 years Correlation Summary
| Measurement | Carpatho Rusyn | Colombian |
| Minimum | 1.6% | 0.54% |
| Maximum | 15.2% | 9.5% |
| Range | 13.6% | 9.0% |
| Mean | 6.1% | 4.9% |
| Median | 4.8% | 5.2% |
| Interquartile 25% (IQ1) | 3.2% | 4.1% |
| Interquartile 75% (IQ3) | 8.8% | 5.9% |
| Interquartile Range (IQR) | 5.6% | 1.8% |
| Standard Deviation (Sample) | 3.5% | 1.9% |
| Standard Deviation (Population) | 3.4% | 1.8% |
Demographics Similar to Carpatho Rusyns and Colombians by Unemployment Among Ages 30 to 34 years
In terms of unemployment among ages 30 to 34 years, the demographic groups most similar to Carpatho Rusyns are Immigrants from Northern Europe (5.3%, a difference of 0.0%), Immigrants from Eastern Europe (5.3%, a difference of 0.010%), Bangladeshi (5.3%, a difference of 0.070%), Palestinian (5.4%, a difference of 0.21%), and Pakistani (5.4%, a difference of 0.26%). Similarly, the demographic groups most similar to Colombians are Immigrants from Colombia (5.4%, a difference of 0.010%), Immigrants from Iran (5.4%, a difference of 0.030%), Ukrainian (5.4%, a difference of 0.040%), Immigrants from Oceania (5.4%, a difference of 0.050%), and Celtic (5.4%, a difference of 0.12%).
| Demographics | Rating | Rank | Unemployment Among Ages 30 to 34 years |
| Immigrants | Eastern Europe | 77.4 /100 | #131 | Good 5.3% |
| Carpatho Rusyns | 77.3 /100 | #132 | Good 5.3% |
| Immigrants | Northern Europe | 77.3 /100 | #133 | Good 5.3% |
| Bangladeshis | 76.6 /100 | #134 | Good 5.3% |
| Palestinians | 75.1 /100 | #135 | Good 5.4% |
| Pakistanis | 74.6 /100 | #136 | Good 5.4% |
| Immigrants | Canada | 74.6 /100 | #137 | Good 5.4% |
| Serbians | 72.9 /100 | #138 | Good 5.4% |
| Lithuanians | 72.4 /100 | #139 | Good 5.4% |
| Immigrants | North America | 72.2 /100 | #140 | Good 5.4% |
| Immigrants | Europe | 72.1 /100 | #141 | Good 5.4% |
| Immigrants | Greece | 72.0 /100 | #142 | Good 5.4% |
| Russians | 71.1 /100 | #143 | Good 5.4% |
| Immigrants | Russia | 71.0 /100 | #144 | Good 5.4% |
| Syrians | 70.3 /100 | #145 | Good 5.4% |
| Celtics | 70.2 /100 | #146 | Good 5.4% |
| Ukrainians | 69.2 /100 | #147 | Good 5.4% |
| Immigrants | Iran | 69.1 /100 | #148 | Good 5.4% |
| Immigrants | Colombia | 68.9 /100 | #149 | Good 5.4% |
| Colombians | 68.7 /100 | #150 | Good 5.4% |
| Immigrants | Oceania | 68.1 /100 | #151 | Good 5.4% |