Cape Verdean vs Irish Unemployment Among Ages 16 to 19 years
COMPARE
Cape Verdean
Irish
Unemployment Among Ages 16 to 19 years
Unemployment Among Ages 16 to 19 years Comparison
Cape Verdeans
Irish
17.5%
UNEMPLOYMENT AMONG AGES 16 TO 19 YEARS
55.8/ 100
METRIC RATING
165th/ 347
METRIC RANK
16.5%
UNEMPLOYMENT AMONG AGES 16 TO 19 YEARS
99.4/ 100
METRIC RATING
59th/ 347
METRIC RANK
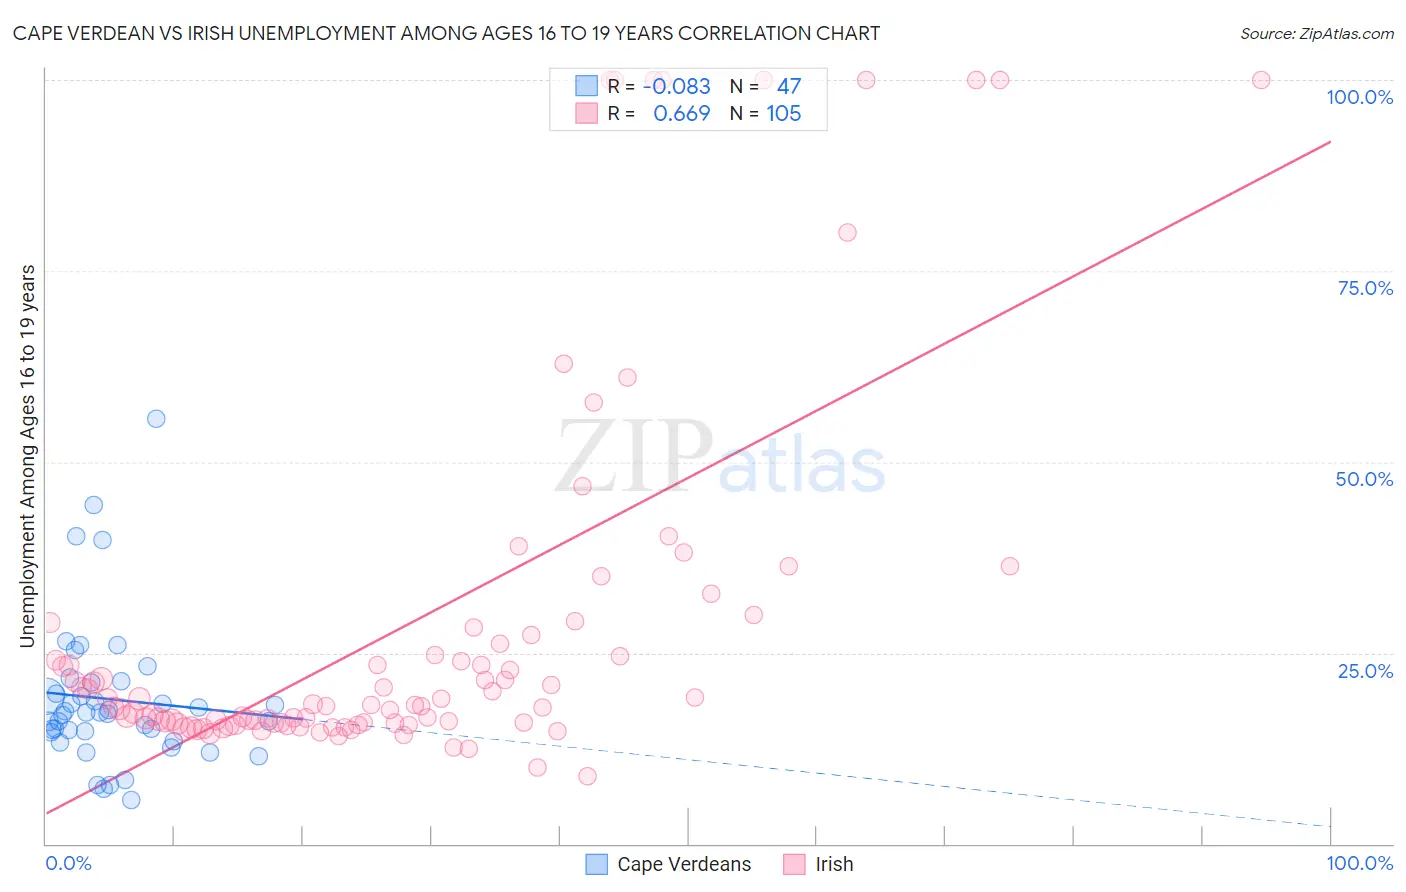
Cape Verdean vs Irish Unemployment Among Ages 16 to 19 years Correlation Chart
The statistical analysis conducted on geographies consisting of 105,654,451 people shows a slight negative correlation between the proportion of Cape Verdeans and unemployment rate among population between the ages 16 and 19 in the United States with a correlation coefficient (R) of -0.083 and weighted average of 17.5%. Similarly, the statistical analysis conducted on geographies consisting of 512,143,285 people shows a significant positive correlation between the proportion of Irish and unemployment rate among population between the ages 16 and 19 in the United States with a correlation coefficient (R) of 0.669 and weighted average of 16.5%, a difference of 6.1%.
Unemployment Among Ages 16 to 19 years Correlation Summary
| Measurement | Cape Verdean | Irish |
| Minimum | 5.7% | 8.8% |
| Maximum | 55.7% | 100.0% |
| Range | 50.0% | 91.2% |
| Mean | 18.9% | 28.6% |
| Median | 17.2% | 18.1% |
| Interquartile 25% (IQ1) | 14.6% | 15.8% |
| Interquartile 75% (IQ3) | 21.2% | 26.8% |
| Interquartile Range (IQR) | 6.6% | 11.0% |
| Standard Deviation (Sample) | 9.6% | 24.6% |
| Standard Deviation (Population) | 9.5% | 24.5% |
Similar Demographics by Unemployment Among Ages 16 to 19 years
Demographics Similar to Cape Verdeans by Unemployment Among Ages 16 to 19 years
In terms of unemployment among ages 16 to 19 years, the demographic groups most similar to Cape Verdeans are Immigrants from Italy (17.5%, a difference of 0.030%), Immigrants from France (17.5%, a difference of 0.040%), Immigrants from Hungary (17.5%, a difference of 0.050%), Immigrants from Cambodia (17.5%, a difference of 0.060%), and Immigrants from Austria (17.5%, a difference of 0.090%).
| Demographics | Rating | Rank | Unemployment Among Ages 16 to 19 years |
| Immigrants | China | 64.1 /100 | #158 | Good 17.5% |
| Koreans | 61.0 /100 | #159 | Good 17.5% |
| Ukrainians | 60.5 /100 | #160 | Good 17.5% |
| Immigrants | Denmark | 60.3 /100 | #161 | Good 17.5% |
| Immigrants | Norway | 59.8 /100 | #162 | Average 17.5% |
| Egyptians | 59.7 /100 | #163 | Average 17.5% |
| Immigrants | Austria | 57.7 /100 | #164 | Average 17.5% |
| Cape Verdeans | 55.8 /100 | #165 | Average 17.5% |
| Immigrants | Italy | 55.2 /100 | #166 | Average 17.5% |
| Immigrants | France | 54.9 /100 | #167 | Average 17.5% |
| Immigrants | Hungary | 54.7 /100 | #168 | Average 17.5% |
| Immigrants | Cambodia | 54.5 /100 | #169 | Average 17.5% |
| Immigrants | Romania | 53.3 /100 | #170 | Average 17.5% |
| Immigrants | Switzerland | 53.2 /100 | #171 | Average 17.5% |
| Immigrants | Western Europe | 52.2 /100 | #172 | Average 17.6% |
Demographics Similar to Irish by Unemployment Among Ages 16 to 19 years
In terms of unemployment among ages 16 to 19 years, the demographic groups most similar to Irish are Immigrants from Uganda (16.5%, a difference of 0.050%), Immigrants from Jordan (16.5%, a difference of 0.10%), Menominee (16.6%, a difference of 0.17%), Immigrants from Cuba (16.6%, a difference of 0.23%), and Macedonian (16.6%, a difference of 0.33%).
| Demographics | Rating | Rank | Unemployment Among Ages 16 to 19 years |
| Welsh | 99.6 /100 | #52 | Exceptional 16.4% |
| Slovenes | 99.6 /100 | #53 | Exceptional 16.4% |
| British | 99.5 /100 | #54 | Exceptional 16.5% |
| Czechoslovakians | 99.5 /100 | #55 | Exceptional 16.5% |
| Sri Lankans | 99.5 /100 | #56 | Exceptional 16.5% |
| Immigrants | Jordan | 99.4 /100 | #57 | Exceptional 16.5% |
| Immigrants | Uganda | 99.4 /100 | #58 | Exceptional 16.5% |
| Irish | 99.4 /100 | #59 | Exceptional 16.5% |
| Menominee | 99.3 /100 | #60 | Exceptional 16.6% |
| Immigrants | Cuba | 99.2 /100 | #61 | Exceptional 16.6% |
| Macedonians | 99.2 /100 | #62 | Exceptional 16.6% |
| Scotch-Irish | 99.1 /100 | #63 | Exceptional 16.6% |
| Northern Europeans | 99.0 /100 | #64 | Exceptional 16.6% |
| Immigrants | Japan | 98.9 /100 | #65 | Exceptional 16.6% |
| Okinawans | 98.9 /100 | #66 | Exceptional 16.6% |