Cape Verdean vs Immigrants from Israel Receiving Food Stamps
COMPARE
Cape Verdean
Immigrants from Israel
Receiving Food Stamps
Receiving Food Stamps Comparison
Cape Verdeans
Immigrants from Israel
21.1%
RECEIVING FOOD STAMPS
0.0/ 100
METRIC RATING
337th/ 347
METRIC RANK
10.0%
RECEIVING FOOD STAMPS
98.5/ 100
METRIC RATING
84th/ 347
METRIC RANK
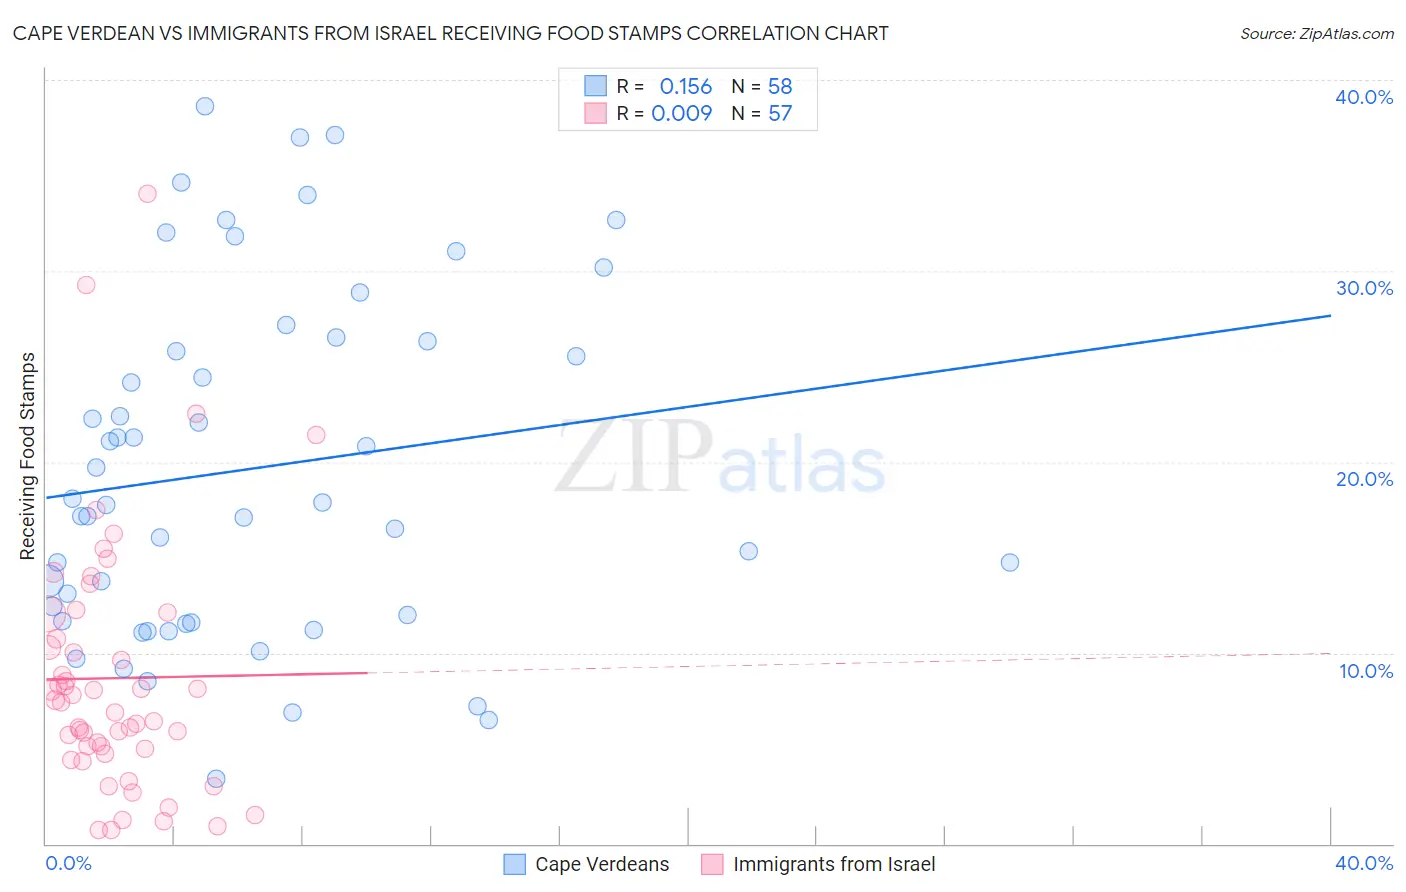
Cape Verdean vs Immigrants from Israel Receiving Food Stamps Correlation Chart
The statistical analysis conducted on geographies consisting of 107,485,738 people shows a poor positive correlation between the proportion of Cape Verdeans and percentage of population receiving government assistance and/or food stamps in the United States with a correlation coefficient (R) of 0.156 and weighted average of 21.1%. Similarly, the statistical analysis conducted on geographies consisting of 209,557,898 people shows no correlation between the proportion of Immigrants from Israel and percentage of population receiving government assistance and/or food stamps in the United States with a correlation coefficient (R) of 0.009 and weighted average of 10.0%, a difference of 110.5%.
Receiving Food Stamps Correlation Summary
| Measurement | Cape Verdean | Immigrants from Israel |
| Minimum | 3.4% | 0.70% |
| Maximum | 38.6% | 34.0% |
| Range | 35.2% | 33.3% |
| Mean | 19.6% | 8.7% |
| Median | 17.8% | 7.4% |
| Interquartile 25% (IQ1) | 11.7% | 4.9% |
| Interquartile 75% (IQ3) | 26.3% | 11.4% |
| Interquartile Range (IQR) | 14.6% | 6.5% |
| Standard Deviation (Sample) | 9.0% | 6.6% |
| Standard Deviation (Population) | 9.0% | 6.6% |
Similar Demographics by Receiving Food Stamps
Demographics Similar to Cape Verdeans by Receiving Food Stamps
In terms of receiving food stamps, the demographic groups most similar to Cape Verdeans are Navajo (21.1%, a difference of 0.060%), Immigrants from Cuba (20.8%, a difference of 1.2%), Dominican (21.4%, a difference of 1.4%), Yakama (21.4%, a difference of 1.7%), and Tohono O'odham (21.5%, a difference of 1.9%).
| Demographics | Rating | Rank | Receiving Food Stamps |
| Pima | 0.0 /100 | #330 | Tragic 19.0% |
| Immigrants | Caribbean | 0.0 /100 | #331 | Tragic 19.6% |
| Pueblo | 0.0 /100 | #332 | Tragic 19.9% |
| Inupiat | 0.0 /100 | #333 | Tragic 20.1% |
| Yuman | 0.0 /100 | #334 | Tragic 20.2% |
| Immigrants | Cuba | 0.0 /100 | #335 | Tragic 20.8% |
| Navajo | 0.0 /100 | #336 | Tragic 21.1% |
| Cape Verdeans | 0.0 /100 | #337 | Tragic 21.1% |
| Dominicans | 0.0 /100 | #338 | Tragic 21.4% |
| Yakama | 0.0 /100 | #339 | Tragic 21.4% |
| Tohono O'odham | 0.0 /100 | #340 | Tragic 21.5% |
| Hopi | 0.0 /100 | #341 | Tragic 21.6% |
| Immigrants | Yemen | 0.0 /100 | #342 | Tragic 21.6% |
| Immigrants | Dominican Republic | 0.0 /100 | #343 | Tragic 22.1% |
| Lumbee | 0.0 /100 | #344 | Tragic 22.9% |
Demographics Similar to Immigrants from Israel by Receiving Food Stamps
In terms of receiving food stamps, the demographic groups most similar to Immigrants from Israel are Austrian (10.0%, a difference of 0.070%), Dutch (10.0%, a difference of 0.070%), Immigrants from Romania (10.0%, a difference of 0.18%), Immigrants from England (10.0%, a difference of 0.20%), and Immigrants from Norway (10.0%, a difference of 0.27%).
| Demographics | Rating | Rank | Receiving Food Stamps |
| Immigrants | North Macedonia | 98.7 /100 | #77 | Exceptional 10.0% |
| South Africans | 98.7 /100 | #78 | Exceptional 10.0% |
| Laotians | 98.7 /100 | #79 | Exceptional 10.0% |
| Poles | 98.6 /100 | #80 | Exceptional 10.0% |
| Immigrants | England | 98.6 /100 | #81 | Exceptional 10.0% |
| Austrians | 98.6 /100 | #82 | Exceptional 10.0% |
| Dutch | 98.6 /100 | #83 | Exceptional 10.0% |
| Immigrants | Israel | 98.5 /100 | #84 | Exceptional 10.0% |
| Immigrants | Romania | 98.5 /100 | #85 | Exceptional 10.0% |
| Immigrants | Norway | 98.4 /100 | #86 | Exceptional 10.0% |
| Egyptians | 98.4 /100 | #87 | Exceptional 10.0% |
| Immigrants | Kuwait | 98.4 /100 | #88 | Exceptional 10.0% |
| Immigrants | France | 98.3 /100 | #89 | Exceptional 10.1% |
| Finns | 97.9 /100 | #90 | Exceptional 10.2% |
| Jordanians | 97.9 /100 | #91 | Exceptional 10.2% |