Cambodian vs Immigrants from Panama Female Poverty
COMPARE
Cambodian
Immigrants from Panama
Female Poverty
Female Poverty Comparison
Cambodians
Immigrants from Panama
12.2%
FEMALE POVERTY
97.5/ 100
METRIC RATING
72nd/ 347
METRIC RANK
14.4%
FEMALE POVERTY
4.7/ 100
METRIC RATING
215th/ 347
METRIC RANK
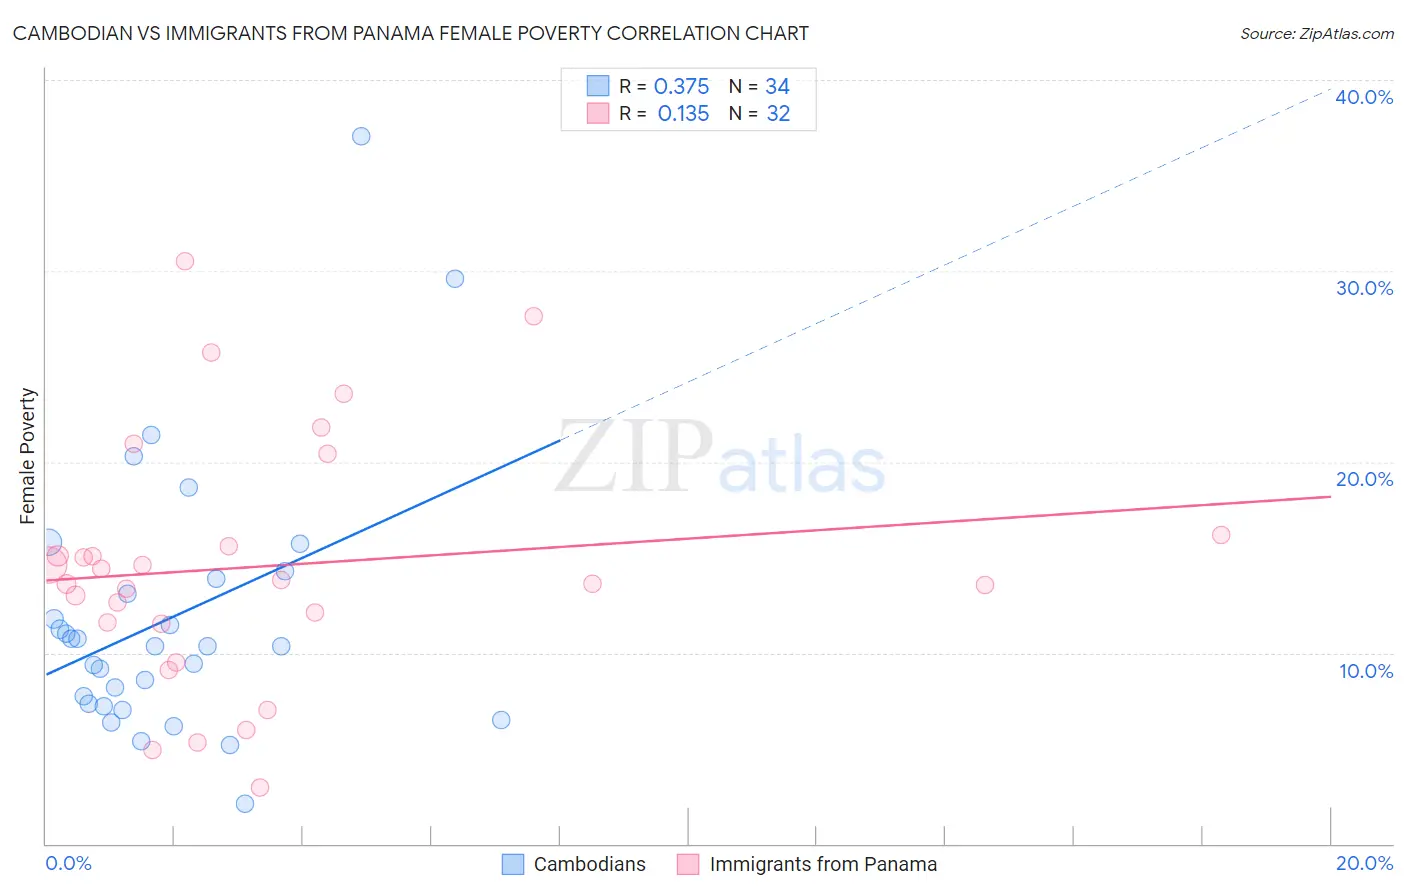
Cambodian vs Immigrants from Panama Female Poverty Correlation Chart
The statistical analysis conducted on geographies consisting of 102,481,907 people shows a mild positive correlation between the proportion of Cambodians and poverty level among females in the United States with a correlation coefficient (R) of 0.375 and weighted average of 12.2%. Similarly, the statistical analysis conducted on geographies consisting of 221,145,499 people shows a poor positive correlation between the proportion of Immigrants from Panama and poverty level among females in the United States with a correlation coefficient (R) of 0.135 and weighted average of 14.4%, a difference of 17.7%.
Female Poverty Correlation Summary
| Measurement | Cambodian | Immigrants from Panama |
| Minimum | 2.1% | 3.0% |
| Maximum | 37.0% | 30.5% |
| Range | 34.9% | 27.5% |
| Mean | 11.9% | 14.5% |
| Median | 10.4% | 13.7% |
| Interquartile 25% (IQ1) | 7.3% | 11.5% |
| Interquartile 75% (IQ3) | 13.9% | 15.9% |
| Interquartile Range (IQR) | 6.5% | 4.3% |
| Standard Deviation (Sample) | 7.0% | 6.5% |
| Standard Deviation (Population) | 6.9% | 6.4% |
Similar Demographics by Female Poverty
Demographics Similar to Cambodians by Female Poverty
In terms of female poverty, the demographic groups most similar to Cambodians are Zimbabwean (12.3%, a difference of 0.020%), Carpatho Rusyn (12.2%, a difference of 0.030%), Immigrants from Canada (12.3%, a difference of 0.030%), European (12.3%, a difference of 0.15%), and Immigrants from Belgium (12.2%, a difference of 0.16%).
| Demographics | Rating | Rank | Female Poverty |
| Indians (Asian) | 97.9 /100 | #65 | Exceptional 12.2% |
| Austrians | 97.9 /100 | #66 | Exceptional 12.2% |
| Immigrants | Eastern Asia | 97.8 /100 | #67 | Exceptional 12.2% |
| Immigrants | Netherlands | 97.8 /100 | #68 | Exceptional 12.2% |
| Swiss | 97.7 /100 | #69 | Exceptional 12.2% |
| Immigrants | Belgium | 97.7 /100 | #70 | Exceptional 12.2% |
| Carpatho Rusyns | 97.6 /100 | #71 | Exceptional 12.2% |
| Cambodians | 97.5 /100 | #72 | Exceptional 12.2% |
| Zimbabweans | 97.5 /100 | #73 | Exceptional 12.3% |
| Immigrants | Canada | 97.5 /100 | #74 | Exceptional 12.3% |
| Europeans | 97.4 /100 | #75 | Exceptional 12.3% |
| Immigrants | Eastern Europe | 97.2 /100 | #76 | Exceptional 12.3% |
| Serbians | 97.2 /100 | #77 | Exceptional 12.3% |
| Egyptians | 97.2 /100 | #78 | Exceptional 12.3% |
| Immigrants | North America | 97.1 /100 | #79 | Exceptional 12.3% |
Demographics Similar to Immigrants from Panama by Female Poverty
In terms of female poverty, the demographic groups most similar to Immigrants from Panama are Immigrants from Thailand (14.4%, a difference of 0.090%), Immigrants (14.4%, a difference of 0.12%), Marshallese (14.4%, a difference of 0.15%), Immigrants from Uzbekistan (14.4%, a difference of 0.17%), and Alaskan Athabascan (14.4%, a difference of 0.30%).
| Demographics | Rating | Rank | Female Poverty |
| Immigrants | Azores | 7.9 /100 | #208 | Tragic 14.2% |
| Panamanians | 7.7 /100 | #209 | Tragic 14.2% |
| Malaysians | 7.4 /100 | #210 | Tragic 14.3% |
| Moroccans | 7.2 /100 | #211 | Tragic 14.3% |
| Bermudans | 5.5 /100 | #212 | Tragic 14.4% |
| Alaskan Athabascans | 5.3 /100 | #213 | Tragic 14.4% |
| Marshallese | 5.0 /100 | #214 | Tragic 14.4% |
| Immigrants | Panama | 4.7 /100 | #215 | Tragic 14.4% |
| Immigrants | Thailand | 4.5 /100 | #216 | Tragic 14.4% |
| Immigrants | Immigrants | 4.5 /100 | #217 | Tragic 14.4% |
| Immigrants | Uzbekistan | 4.4 /100 | #218 | Tragic 14.4% |
| Japanese | 4.1 /100 | #219 | Tragic 14.5% |
| Alsatians | 4.0 /100 | #220 | Tragic 14.5% |
| Immigrants | Cambodia | 3.7 /100 | #221 | Tragic 14.5% |
| Immigrants | Nonimmigrants | 3.7 /100 | #222 | Tragic 14.5% |