Cajun vs Korean Female Poverty Among 25-34 Year Olds
COMPARE
Cajun
Korean
Female Poverty Among 25-34 Year Olds
Female Poverty Among 25-34 Year Olds Comparison
Cajuns
Koreans
19.9%
FEMALE POVERTY AMONG 25-34 YEAR OLDS
0.0/ 100
METRIC RATING
333rd/ 347
METRIC RANK
12.0%
FEMALE POVERTY AMONG 25-34 YEAR OLDS
99.6/ 100
METRIC RATING
47th/ 347
METRIC RANK
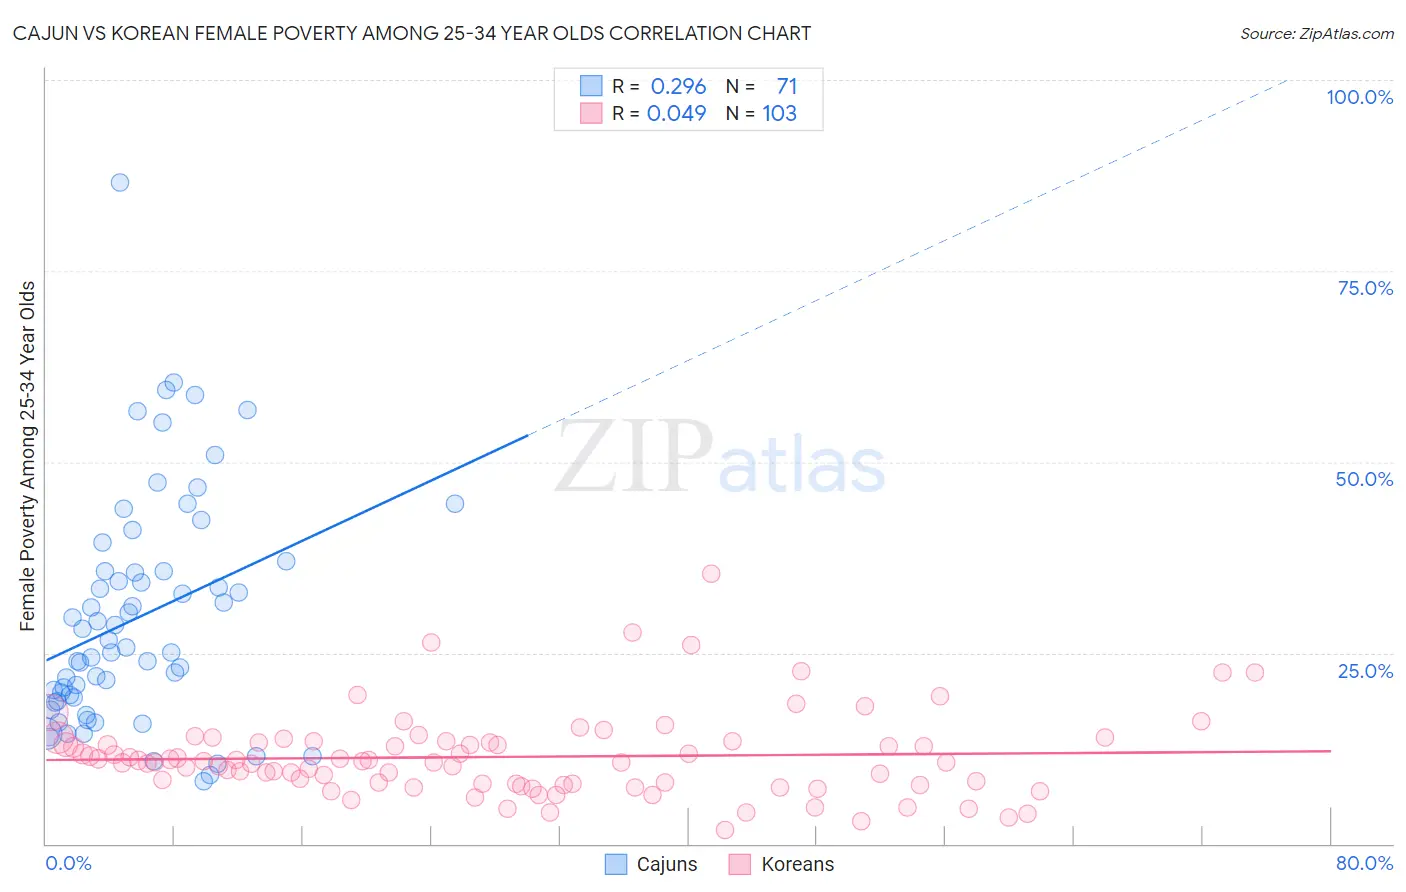
Cajun vs Korean Female Poverty Among 25-34 Year Olds Correlation Chart
The statistical analysis conducted on geographies consisting of 148,590,525 people shows a weak positive correlation between the proportion of Cajuns and poverty level among females between the ages 25 and 34 in the United States with a correlation coefficient (R) of 0.296 and weighted average of 19.9%. Similarly, the statistical analysis conducted on geographies consisting of 498,385,701 people shows no correlation between the proportion of Koreans and poverty level among females between the ages 25 and 34 in the United States with a correlation coefficient (R) of 0.049 and weighted average of 12.0%, a difference of 66.7%.
Female Poverty Among 25-34 Year Olds Correlation Summary
| Measurement | Cajun | Korean |
| Minimum | 8.2% | 1.8% |
| Maximum | 86.6% | 35.4% |
| Range | 78.4% | 33.6% |
| Mean | 29.6% | 11.4% |
| Median | 25.7% | 10.7% |
| Interquartile 25% (IQ1) | 18.6% | 7.8% |
| Interquartile 75% (IQ3) | 35.7% | 13.4% |
| Interquartile Range (IQR) | 17.1% | 5.6% |
| Standard Deviation (Sample) | 15.1% | 5.5% |
| Standard Deviation (Population) | 15.0% | 5.5% |
Similar Demographics by Female Poverty Among 25-34 Year Olds
Demographics Similar to Cajuns by Female Poverty Among 25-34 Year Olds
In terms of female poverty among 25-34 year olds, the demographic groups most similar to Cajuns are Apache (20.1%, a difference of 0.68%), Immigrants from Yemen (19.8%, a difference of 0.80%), Kiowa (19.7%, a difference of 1.4%), Native/Alaskan (20.3%, a difference of 1.8%), and Paiute (19.6%, a difference of 1.8%).
| Demographics | Rating | Rank | Female Poverty Among 25-34 Year Olds |
| Blacks/African Americans | 0.0 /100 | #326 | Tragic 18.9% |
| Cheyenne | 0.0 /100 | #327 | Tragic 19.1% |
| Alaskan Athabascans | 0.0 /100 | #328 | Tragic 19.1% |
| Creek | 0.0 /100 | #329 | Tragic 19.2% |
| Paiute | 0.0 /100 | #330 | Tragic 19.6% |
| Kiowa | 0.0 /100 | #331 | Tragic 19.7% |
| Immigrants | Yemen | 0.0 /100 | #332 | Tragic 19.8% |
| Cajuns | 0.0 /100 | #333 | Tragic 19.9% |
| Apache | 0.0 /100 | #334 | Tragic 20.1% |
| Natives/Alaskans | 0.0 /100 | #335 | Tragic 20.3% |
| Pueblo | 0.0 /100 | #336 | Tragic 22.2% |
| Crow | 0.0 /100 | #337 | Tragic 22.7% |
| Houma | 0.0 /100 | #338 | Tragic 22.7% |
| Yuman | 0.0 /100 | #339 | Tragic 22.9% |
| Sioux | 0.0 /100 | #340 | Tragic 23.0% |
Demographics Similar to Koreans by Female Poverty Among 25-34 Year Olds
In terms of female poverty among 25-34 year olds, the demographic groups most similar to Koreans are Immigrants from Belarus (12.0%, a difference of 0.050%), Immigrants from Egypt (12.0%, a difference of 0.13%), Immigrants from Croatia (12.0%, a difference of 0.15%), Paraguayan (12.0%, a difference of 0.15%), and Immigrants from Serbia (11.9%, a difference of 0.16%).
| Demographics | Rating | Rank | Female Poverty Among 25-34 Year Olds |
| Immigrants | Bulgaria | 99.8 /100 | #40 | Exceptional 11.8% |
| Immigrants | Indonesia | 99.8 /100 | #41 | Exceptional 11.8% |
| Immigrants | Turkey | 99.7 /100 | #42 | Exceptional 11.9% |
| Egyptians | 99.7 /100 | #43 | Exceptional 11.9% |
| Immigrants | Australia | 99.7 /100 | #44 | Exceptional 11.9% |
| Macedonians | 99.7 /100 | #45 | Exceptional 11.9% |
| Immigrants | Serbia | 99.7 /100 | #46 | Exceptional 11.9% |
| Koreans | 99.6 /100 | #47 | Exceptional 12.0% |
| Immigrants | Belarus | 99.6 /100 | #48 | Exceptional 12.0% |
| Immigrants | Egypt | 99.6 /100 | #49 | Exceptional 12.0% |
| Immigrants | Croatia | 99.6 /100 | #50 | Exceptional 12.0% |
| Paraguayans | 99.6 /100 | #51 | Exceptional 12.0% |
| Immigrants | Eastern Europe | 99.6 /100 | #52 | Exceptional 12.0% |
| Immigrants | Israel | 99.6 /100 | #53 | Exceptional 12.0% |
| Eastern Europeans | 99.6 /100 | #54 | Exceptional 12.0% |