Burmese vs Immigrants from Switzerland Child Poverty Under the Age of 16
COMPARE
Burmese
Immigrants from Switzerland
Child Poverty Under the Age of 16
Child Poverty Under the Age of 16 Comparison
Burmese
Immigrants from Switzerland
12.8%
CHILD POVERTY UNDER THE AGE OF 16
99.9/ 100
METRIC RATING
13th/ 347
METRIC RANK
14.8%
CHILD POVERTY UNDER THE AGE OF 16
95.1/ 100
METRIC RATING
101st/ 347
METRIC RANK
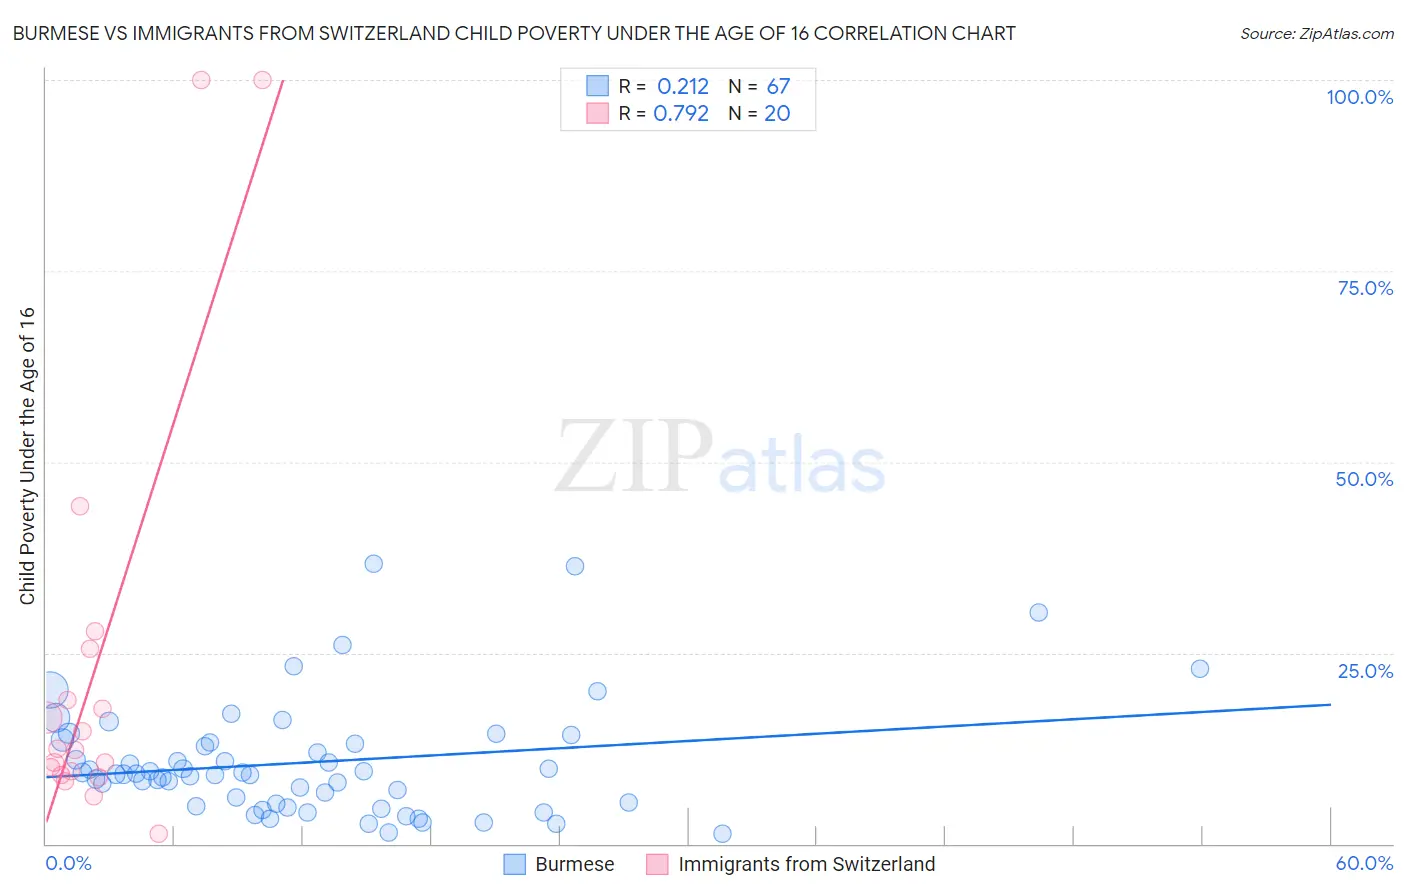
Burmese vs Immigrants from Switzerland Child Poverty Under the Age of 16 Correlation Chart
The statistical analysis conducted on geographies consisting of 459,540,919 people shows a weak positive correlation between the proportion of Burmese and poverty level among children under the age of 16 in the United States with a correlation coefficient (R) of 0.212 and weighted average of 12.8%. Similarly, the statistical analysis conducted on geographies consisting of 147,239,417 people shows a strong positive correlation between the proportion of Immigrants from Switzerland and poverty level among children under the age of 16 in the United States with a correlation coefficient (R) of 0.792 and weighted average of 14.8%, a difference of 15.3%.
Child Poverty Under the Age of 16 Correlation Summary
| Measurement | Burmese | Immigrants from Switzerland |
| Minimum | 1.4% | 1.3% |
| Maximum | 36.7% | 100.0% |
| Range | 35.4% | 98.7% |
| Mean | 10.7% | 23.2% |
| Median | 9.1% | 12.4% |
| Interquartile 25% (IQ1) | 5.3% | 9.3% |
| Interquartile 75% (IQ3) | 13.2% | 22.1% |
| Interquartile Range (IQR) | 8.0% | 12.9% |
| Standard Deviation (Sample) | 7.5% | 27.9% |
| Standard Deviation (Population) | 7.4% | 27.2% |
Similar Demographics by Child Poverty Under the Age of 16
Demographics Similar to Burmese by Child Poverty Under the Age of 16
In terms of child poverty under the age of 16, the demographic groups most similar to Burmese are Immigrants from Lithuania (12.9%, a difference of 0.84%), Immigrants from Ireland (12.7%, a difference of 1.1%), Immigrants from Korea (13.0%, a difference of 1.1%), Norwegian (13.0%, a difference of 1.2%), and Bulgarian (13.0%, a difference of 1.4%).
| Demographics | Rating | Rank | Child Poverty Under the Age of 16 |
| Immigrants | Hong Kong | 100.0 /100 | #6 | Exceptional 12.1% |
| Iranians | 100.0 /100 | #7 | Exceptional 12.2% |
| Immigrants | Singapore | 100.0 /100 | #8 | Exceptional 12.4% |
| Immigrants | Iran | 100.0 /100 | #9 | Exceptional 12.4% |
| Immigrants | South Central Asia | 99.9 /100 | #10 | Exceptional 12.5% |
| Bhutanese | 99.9 /100 | #11 | Exceptional 12.5% |
| Immigrants | Ireland | 99.9 /100 | #12 | Exceptional 12.7% |
| Burmese | 99.9 /100 | #13 | Exceptional 12.8% |
| Immigrants | Lithuania | 99.9 /100 | #14 | Exceptional 12.9% |
| Immigrants | Korea | 99.9 /100 | #15 | Exceptional 13.0% |
| Norwegians | 99.9 /100 | #16 | Exceptional 13.0% |
| Bulgarians | 99.9 /100 | #17 | Exceptional 13.0% |
| Cypriots | 99.9 /100 | #18 | Exceptional 13.0% |
| Immigrants | Japan | 99.8 /100 | #19 | Exceptional 13.0% |
| Okinawans | 99.8 /100 | #20 | Exceptional 13.1% |
Demographics Similar to Immigrants from Switzerland by Child Poverty Under the Age of 16
In terms of child poverty under the age of 16, the demographic groups most similar to Immigrants from Switzerland are Dutch (14.8%, a difference of 0.010%), Romanian (14.8%, a difference of 0.070%), Immigrants from Egypt (14.8%, a difference of 0.11%), Immigrants from England (14.8%, a difference of 0.16%), and Basque (14.8%, a difference of 0.27%).
| Demographics | Rating | Rank | Child Poverty Under the Age of 16 |
| Immigrants | South Africa | 96.3 /100 | #94 | Exceptional 14.6% |
| Immigrants | Croatia | 96.1 /100 | #95 | Exceptional 14.6% |
| Immigrants | France | 95.8 /100 | #96 | Exceptional 14.7% |
| Paraguayans | 95.7 /100 | #97 | Exceptional 14.7% |
| Immigrants | Belarus | 95.7 /100 | #98 | Exceptional 14.7% |
| British | 95.5 /100 | #99 | Exceptional 14.7% |
| Dutch | 95.1 /100 | #100 | Exceptional 14.8% |
| Immigrants | Switzerland | 95.1 /100 | #101 | Exceptional 14.8% |
| Romanians | 95.0 /100 | #102 | Exceptional 14.8% |
| Immigrants | Egypt | 94.9 /100 | #103 | Exceptional 14.8% |
| Immigrants | England | 94.8 /100 | #104 | Exceptional 14.8% |
| Basques | 94.7 /100 | #105 | Exceptional 14.8% |
| Serbians | 94.5 /100 | #106 | Exceptional 14.8% |
| Chileans | 94.4 /100 | #107 | Exceptional 14.8% |
| Jordanians | 94.2 /100 | #108 | Exceptional 14.8% |