Immigrants from Zaire vs Immigrants from Switzerland Child Poverty Under the Age of 16
COMPARE
Immigrants from Zaire
Immigrants from Switzerland
Child Poverty Under the Age of 16
Child Poverty Under the Age of 16 Comparison
Immigrants from Zaire
Immigrants from Switzerland
20.1%
CHILD POVERTY UNDER THE AGE OF 16
0.0/ 100
METRIC RATING
283rd/ 347
METRIC RANK
14.8%
CHILD POVERTY UNDER THE AGE OF 16
95.1/ 100
METRIC RATING
101st/ 347
METRIC RANK
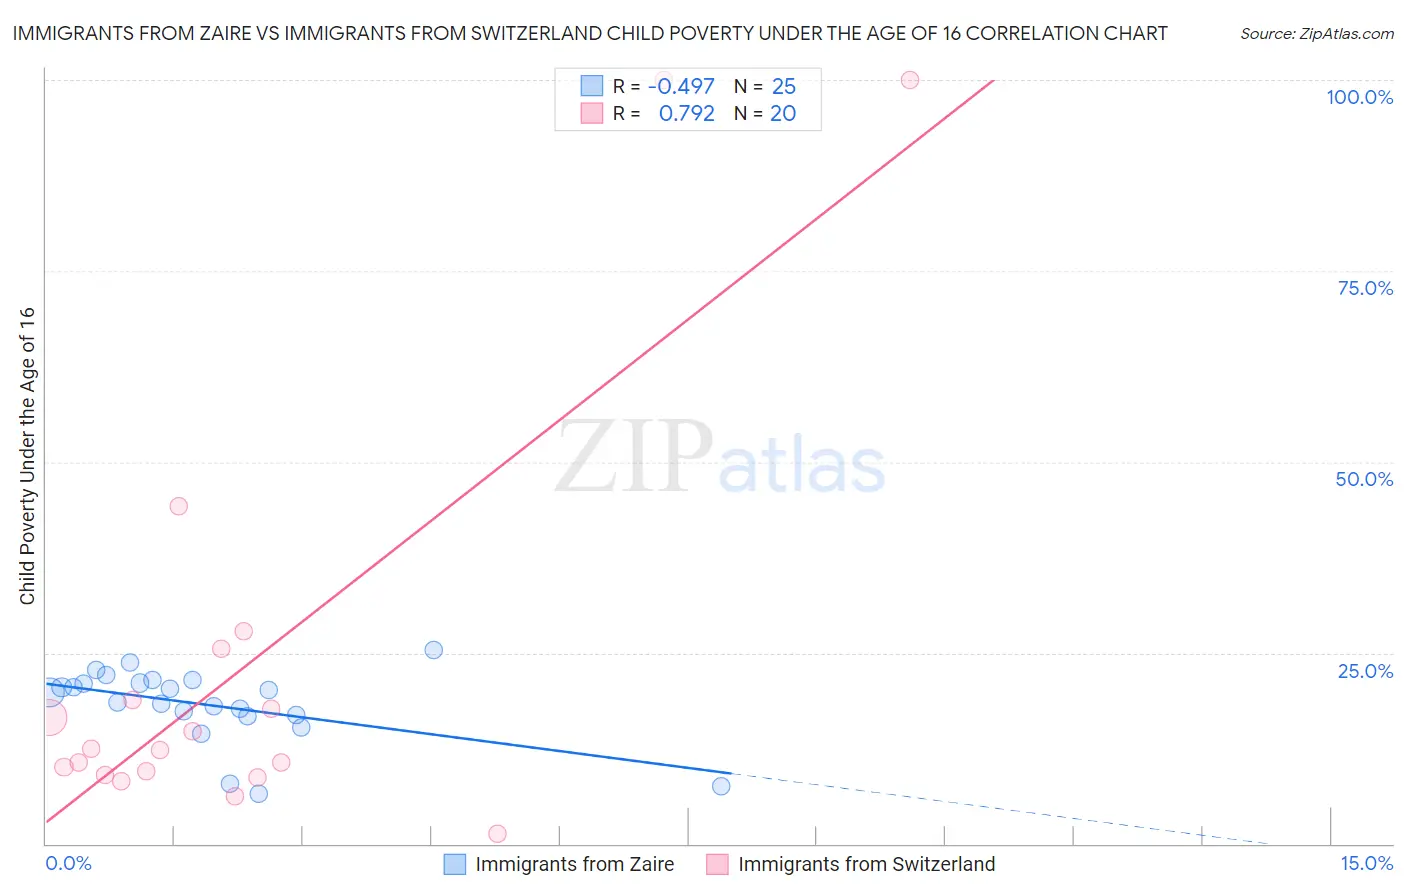
Immigrants from Zaire vs Immigrants from Switzerland Child Poverty Under the Age of 16 Correlation Chart
The statistical analysis conducted on geographies consisting of 107,166,496 people shows a moderate negative correlation between the proportion of Immigrants from Zaire and poverty level among children under the age of 16 in the United States with a correlation coefficient (R) of -0.497 and weighted average of 20.1%. Similarly, the statistical analysis conducted on geographies consisting of 147,239,417 people shows a strong positive correlation between the proportion of Immigrants from Switzerland and poverty level among children under the age of 16 in the United States with a correlation coefficient (R) of 0.792 and weighted average of 14.8%, a difference of 36.1%.
Child Poverty Under the Age of 16 Correlation Summary
| Measurement | Immigrants from Zaire | Immigrants from Switzerland |
| Minimum | 6.5% | 1.3% |
| Maximum | 25.4% | 100.0% |
| Range | 18.9% | 98.7% |
| Mean | 18.2% | 23.2% |
| Median | 19.9% | 12.4% |
| Interquartile 25% (IQ1) | 16.8% | 9.3% |
| Interquartile 75% (IQ3) | 21.2% | 22.1% |
| Interquartile Range (IQR) | 4.4% | 12.9% |
| Standard Deviation (Sample) | 4.8% | 27.9% |
| Standard Deviation (Population) | 4.7% | 27.2% |
Similar Demographics by Child Poverty Under the Age of 16
Demographics Similar to Immigrants from Zaire by Child Poverty Under the Age of 16
In terms of child poverty under the age of 16, the demographic groups most similar to Immigrants from Zaire are West Indian (20.1%, a difference of 0.14%), Immigrants from St. Vincent and the Grenadines (20.1%, a difference of 0.21%), Barbadian (20.0%, a difference of 0.23%), Central American (20.0%, a difference of 0.26%), and Immigrants from West Indies (20.2%, a difference of 0.35%).
| Demographics | Rating | Rank | Child Poverty Under the Age of 16 |
| Belizeans | 0.1 /100 | #276 | Tragic 19.9% |
| Iroquois | 0.1 /100 | #277 | Tragic 19.9% |
| Bangladeshis | 0.0 /100 | #278 | Tragic 19.9% |
| Sub-Saharan Africans | 0.0 /100 | #279 | Tragic 19.9% |
| Comanche | 0.0 /100 | #280 | Tragic 19.9% |
| Central Americans | 0.0 /100 | #281 | Tragic 20.0% |
| Barbadians | 0.0 /100 | #282 | Tragic 20.0% |
| Immigrants | Zaire | 0.0 /100 | #283 | Tragic 20.1% |
| West Indians | 0.0 /100 | #284 | Tragic 20.1% |
| Immigrants | St. Vincent and the Grenadines | 0.0 /100 | #285 | Tragic 20.1% |
| Immigrants | West Indies | 0.0 /100 | #286 | Tragic 20.2% |
| Blackfeet | 0.0 /100 | #287 | Tragic 20.2% |
| Immigrants | Belize | 0.0 /100 | #288 | Tragic 20.3% |
| Senegalese | 0.0 /100 | #289 | Tragic 20.4% |
| Yaqui | 0.0 /100 | #290 | Tragic 20.4% |
Demographics Similar to Immigrants from Switzerland by Child Poverty Under the Age of 16
In terms of child poverty under the age of 16, the demographic groups most similar to Immigrants from Switzerland are Dutch (14.8%, a difference of 0.010%), Romanian (14.8%, a difference of 0.070%), Immigrants from Egypt (14.8%, a difference of 0.11%), Immigrants from England (14.8%, a difference of 0.16%), and Basque (14.8%, a difference of 0.27%).
| Demographics | Rating | Rank | Child Poverty Under the Age of 16 |
| Immigrants | South Africa | 96.3 /100 | #94 | Exceptional 14.6% |
| Immigrants | Croatia | 96.1 /100 | #95 | Exceptional 14.6% |
| Immigrants | France | 95.8 /100 | #96 | Exceptional 14.7% |
| Paraguayans | 95.7 /100 | #97 | Exceptional 14.7% |
| Immigrants | Belarus | 95.7 /100 | #98 | Exceptional 14.7% |
| British | 95.5 /100 | #99 | Exceptional 14.7% |
| Dutch | 95.1 /100 | #100 | Exceptional 14.8% |
| Immigrants | Switzerland | 95.1 /100 | #101 | Exceptional 14.8% |
| Romanians | 95.0 /100 | #102 | Exceptional 14.8% |
| Immigrants | Egypt | 94.9 /100 | #103 | Exceptional 14.8% |
| Immigrants | England | 94.8 /100 | #104 | Exceptional 14.8% |
| Basques | 94.7 /100 | #105 | Exceptional 14.8% |
| Serbians | 94.5 /100 | #106 | Exceptional 14.8% |
| Chileans | 94.4 /100 | #107 | Exceptional 14.8% |
| Jordanians | 94.2 /100 | #108 | Exceptional 14.8% |