Burmese vs Immigrants from South America Family Poverty
COMPARE
Burmese
Immigrants from South America
Family Poverty
Family Poverty Comparison
Burmese
Immigrants from South America
7.3%
FAMILY POVERTY
99.7/ 100
METRIC RATING
25th/ 347
METRIC RANK
9.5%
FAMILY POVERTY
18.0/ 100
METRIC RATING
206th/ 347
METRIC RANK
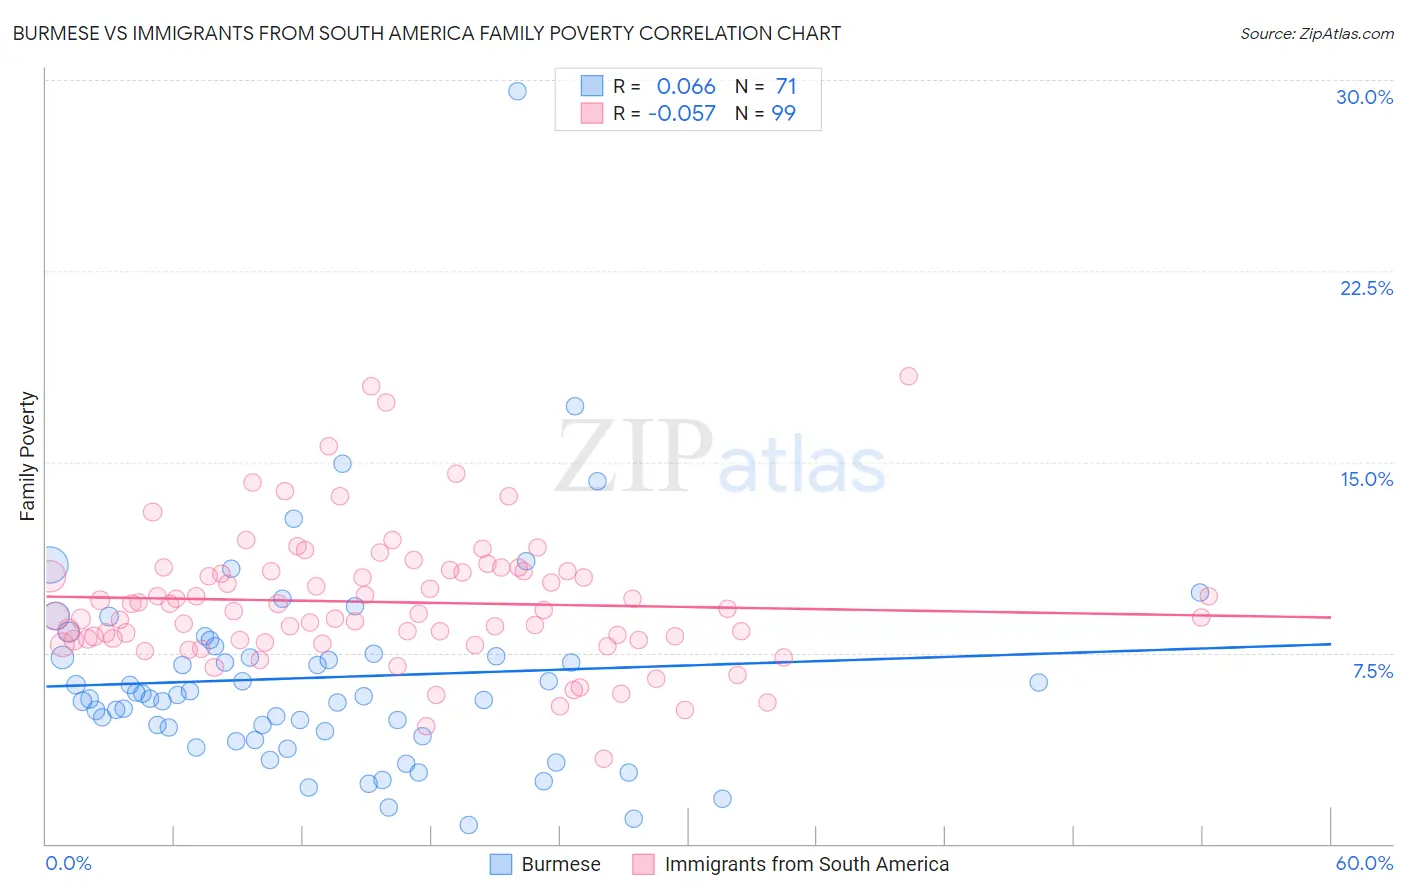
Burmese vs Immigrants from South America Family Poverty Correlation Chart
The statistical analysis conducted on geographies consisting of 463,380,335 people shows a slight positive correlation between the proportion of Burmese and poverty level among families in the United States with a correlation coefficient (R) of 0.066 and weighted average of 7.3%. Similarly, the statistical analysis conducted on geographies consisting of 484,267,691 people shows a slight negative correlation between the proportion of Immigrants from South America and poverty level among families in the United States with a correlation coefficient (R) of -0.057 and weighted average of 9.5%, a difference of 29.1%.
Family Poverty Correlation Summary
| Measurement | Burmese | Immigrants from South America |
| Minimum | 0.76% | 3.3% |
| Maximum | 29.5% | 18.4% |
| Range | 28.8% | 15.1% |
| Mean | 6.5% | 9.5% |
| Median | 5.8% | 9.1% |
| Interquartile 25% (IQ1) | 4.2% | 8.0% |
| Interquartile 75% (IQ3) | 7.5% | 10.7% |
| Interquartile Range (IQR) | 3.2% | 2.7% |
| Standard Deviation (Sample) | 4.2% | 2.6% |
| Standard Deviation (Population) | 4.2% | 2.6% |
Similar Demographics by Family Poverty
Demographics Similar to Burmese by Family Poverty
In terms of family poverty, the demographic groups most similar to Burmese are Croatian (7.3%, a difference of 0.0%), Cypriot (7.3%, a difference of 0.24%), Immigrants from Scotland (7.3%, a difference of 0.26%), Assyrian/Chaldean/Syriac (7.3%, a difference of 0.30%), and Danish (7.3%, a difference of 0.32%).
| Demographics | Rating | Rank | Family Poverty |
| Immigrants | Lithuania | 99.8 /100 | #18 | Exceptional 7.2% |
| Eastern Europeans | 99.7 /100 | #19 | Exceptional 7.2% |
| Immigrants | Hong Kong | 99.7 /100 | #20 | Exceptional 7.3% |
| Immigrants | Iran | 99.7 /100 | #21 | Exceptional 7.3% |
| Danes | 99.7 /100 | #22 | Exceptional 7.3% |
| Assyrians/Chaldeans/Syriacs | 99.7 /100 | #23 | Exceptional 7.3% |
| Croatians | 99.7 /100 | #24 | Exceptional 7.3% |
| Burmese | 99.7 /100 | #25 | Exceptional 7.3% |
| Cypriots | 99.6 /100 | #26 | Exceptional 7.3% |
| Immigrants | Scotland | 99.6 /100 | #27 | Exceptional 7.3% |
| Immigrants | Korea | 99.6 /100 | #28 | Exceptional 7.4% |
| Immigrants | Northern Europe | 99.6 /100 | #29 | Exceptional 7.4% |
| Italians | 99.6 /100 | #30 | Exceptional 7.4% |
| Czechs | 99.6 /100 | #31 | Exceptional 7.4% |
| Poles | 99.5 /100 | #32 | Exceptional 7.4% |
Demographics Similar to Immigrants from South America by Family Poverty
In terms of family poverty, the demographic groups most similar to Immigrants from South America are Aleut (9.5%, a difference of 0.010%), Immigrants from Lebanon (9.4%, a difference of 0.20%), German Russian (9.4%, a difference of 0.30%), Immigrants from Sierra Leone (9.4%, a difference of 0.34%), and Immigrants from Portugal (9.4%, a difference of 0.52%).
| Demographics | Rating | Rank | Family Poverty |
| Spaniards | 22.8 /100 | #199 | Fair 9.4% |
| Immigrants | Costa Rica | 21.7 /100 | #200 | Fair 9.4% |
| Immigrants | Portugal | 20.5 /100 | #201 | Fair 9.4% |
| Immigrants | Sierra Leone | 19.6 /100 | #202 | Poor 9.4% |
| German Russians | 19.4 /100 | #203 | Poor 9.4% |
| Immigrants | Lebanon | 18.9 /100 | #204 | Poor 9.4% |
| Aleuts | 18.0 /100 | #205 | Poor 9.5% |
| Immigrants | South America | 18.0 /100 | #206 | Poor 9.5% |
| Sierra Leoneans | 15.6 /100 | #207 | Poor 9.5% |
| Immigrants | Eastern Africa | 15.1 /100 | #208 | Poor 9.5% |
| Immigrants | Uruguay | 14.0 /100 | #209 | Poor 9.5% |
| Alsatians | 11.3 /100 | #210 | Poor 9.6% |
| Malaysians | 10.6 /100 | #211 | Poor 9.6% |
| Immigrants | Thailand | 9.7 /100 | #212 | Tragic 9.7% |
| Osage | 8.0 /100 | #213 | Tragic 9.7% |