Burmese vs Immigrants from South America Female Unemployment
COMPARE
Burmese
Immigrants from South America
Female Unemployment
Female Unemployment Comparison
Burmese
Immigrants from South America
5.0%
FEMALE UNEMPLOYMENT
95.6/ 100
METRIC RATING
95th/ 347
METRIC RANK
5.5%
FEMALE UNEMPLOYMENT
2.9/ 100
METRIC RATING
240th/ 347
METRIC RANK
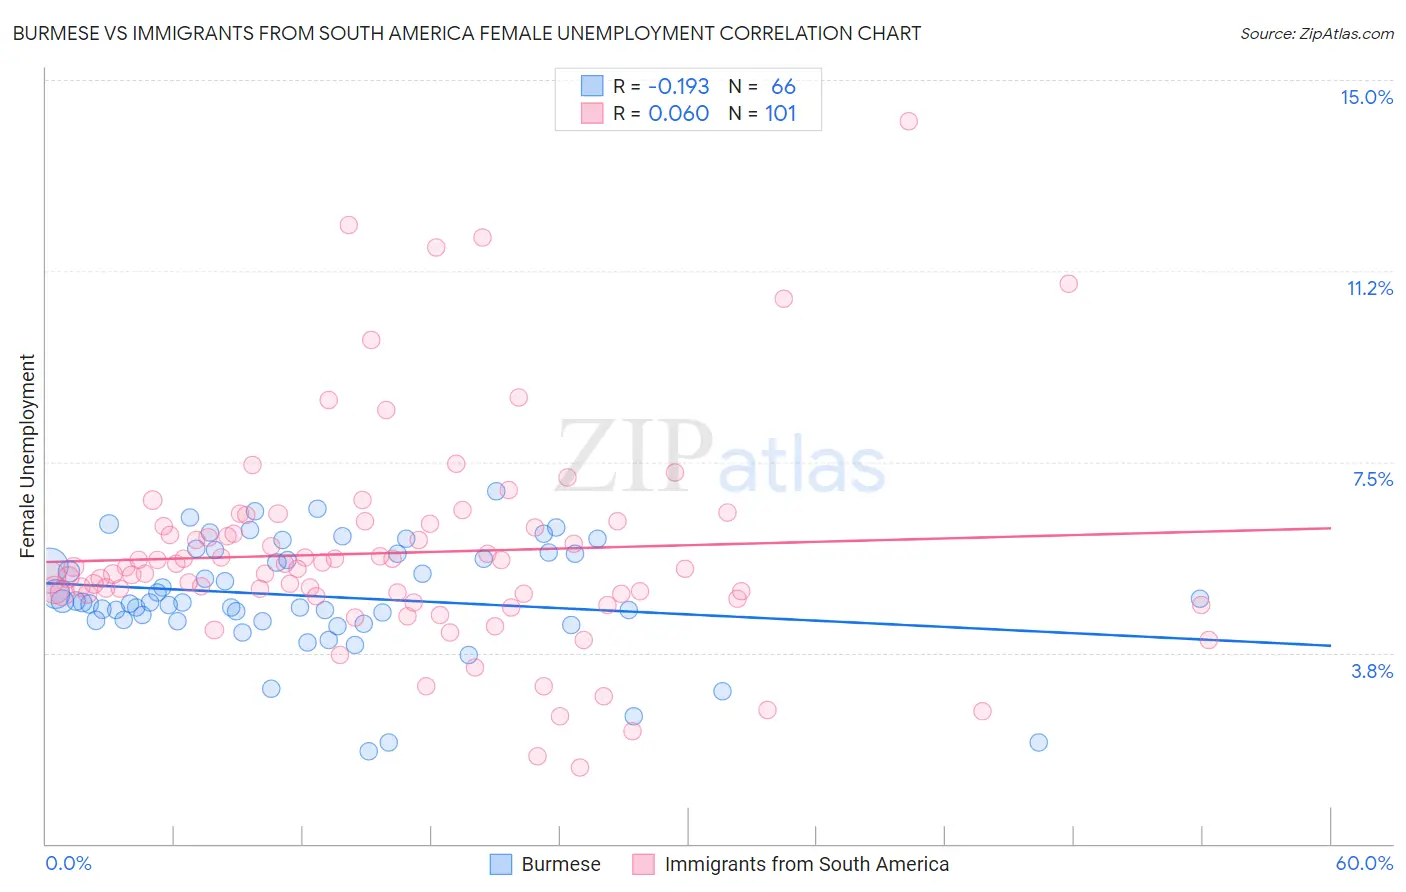
Burmese vs Immigrants from South America Female Unemployment Correlation Chart
The statistical analysis conducted on geographies consisting of 462,170,417 people shows a poor negative correlation between the proportion of Burmese and unemploymnet rate among females in the United States with a correlation coefficient (R) of -0.193 and weighted average of 5.0%. Similarly, the statistical analysis conducted on geographies consisting of 482,537,593 people shows a slight positive correlation between the proportion of Immigrants from South America and unemploymnet rate among females in the United States with a correlation coefficient (R) of 0.060 and weighted average of 5.5%, a difference of 10.4%.
Female Unemployment Correlation Summary
| Measurement | Burmese | Immigrants from South America |
| Minimum | 1.8% | 1.5% |
| Maximum | 6.9% | 14.2% |
| Range | 5.1% | 12.7% |
| Mean | 4.9% | 5.7% |
| Median | 4.7% | 5.4% |
| Interquartile 25% (IQ1) | 4.4% | 4.9% |
| Interquartile 75% (IQ3) | 5.7% | 6.3% |
| Interquartile Range (IQR) | 1.3% | 1.4% |
| Standard Deviation (Sample) | 1.1% | 2.1% |
| Standard Deviation (Population) | 1.1% | 2.1% |
Similar Demographics by Female Unemployment
Demographics Similar to Burmese by Female Unemployment
In terms of female unemployment, the demographic groups most similar to Burmese are Immigrants from Malaysia (5.0%, a difference of 0.020%), Immigrants from Austria (5.0%, a difference of 0.040%), Immigrants from South Central Asia (5.0%, a difference of 0.040%), Romanian (5.0%, a difference of 0.12%), and Immigrants from Japan (5.0%, a difference of 0.15%).
| Demographics | Rating | Rank | Female Unemployment |
| Immigrants | Sudan | 96.7 /100 | #88 | Exceptional 5.0% |
| Immigrants | Taiwan | 96.6 /100 | #89 | Exceptional 5.0% |
| Immigrants | Sweden | 96.3 /100 | #90 | Exceptional 5.0% |
| Immigrants | Japan | 96.0 /100 | #91 | Exceptional 5.0% |
| Romanians | 95.9 /100 | #92 | Exceptional 5.0% |
| Immigrants | Austria | 95.7 /100 | #93 | Exceptional 5.0% |
| Immigrants | Malaysia | 95.7 /100 | #94 | Exceptional 5.0% |
| Burmese | 95.6 /100 | #95 | Exceptional 5.0% |
| Immigrants | South Central Asia | 95.5 /100 | #96 | Exceptional 5.0% |
| Immigrants | Somalia | 95.2 /100 | #97 | Exceptional 5.0% |
| Immigrants | Kuwait | 95.2 /100 | #98 | Exceptional 5.0% |
| Immigrants | Zaire | 95.2 /100 | #99 | Exceptional 5.0% |
| Indonesians | 95.1 /100 | #100 | Exceptional 5.0% |
| Immigrants | Czechoslovakia | 95.0 /100 | #101 | Exceptional 5.0% |
| Immigrants | Kenya | 94.8 /100 | #102 | Exceptional 5.0% |
Demographics Similar to Immigrants from South America by Female Unemployment
In terms of female unemployment, the demographic groups most similar to Immigrants from South America are Aleut (5.5%, a difference of 0.040%), South American Indian (5.5%, a difference of 0.050%), Sierra Leonean (5.5%, a difference of 0.14%), Immigrants from Panama (5.5%, a difference of 0.16%), and Immigrants from Cambodia (5.5%, a difference of 0.18%).
| Demographics | Rating | Rank | Female Unemployment |
| Moroccans | 3.4 /100 | #233 | Tragic 5.5% |
| Immigrants | Lebanon | 3.3 /100 | #234 | Tragic 5.5% |
| Immigrants | Iran | 3.3 /100 | #235 | Tragic 5.5% |
| Immigrants | Cambodia | 3.3 /100 | #236 | Tragic 5.5% |
| Immigrants | Panama | 3.2 /100 | #237 | Tragic 5.5% |
| Sierra Leoneans | 3.2 /100 | #238 | Tragic 5.5% |
| Aleuts | 3.0 /100 | #239 | Tragic 5.5% |
| Immigrants | South America | 2.9 /100 | #240 | Tragic 5.5% |
| South American Indians | 2.8 /100 | #241 | Tragic 5.5% |
| Marshallese | 2.3 /100 | #242 | Tragic 5.6% |
| Spanish Americans | 2.2 /100 | #243 | Tragic 5.6% |
| Immigrants | Liberia | 1.5 /100 | #244 | Tragic 5.6% |
| Guamanians/Chamorros | 1.4 /100 | #245 | Tragic 5.6% |
| Japanese | 1.2 /100 | #246 | Tragic 5.6% |
| Immigrants | Western Asia | 1.1 /100 | #247 | Tragic 5.6% |