Ottawa vs Immigrants from South America Family Poverty
COMPARE
Ottawa
Immigrants from South America
Family Poverty
Family Poverty Comparison
Ottawa
Immigrants from South America
10.0%
FAMILY POVERTY
3.3/ 100
METRIC RATING
226th/ 347
METRIC RANK
9.5%
FAMILY POVERTY
18.0/ 100
METRIC RATING
206th/ 347
METRIC RANK
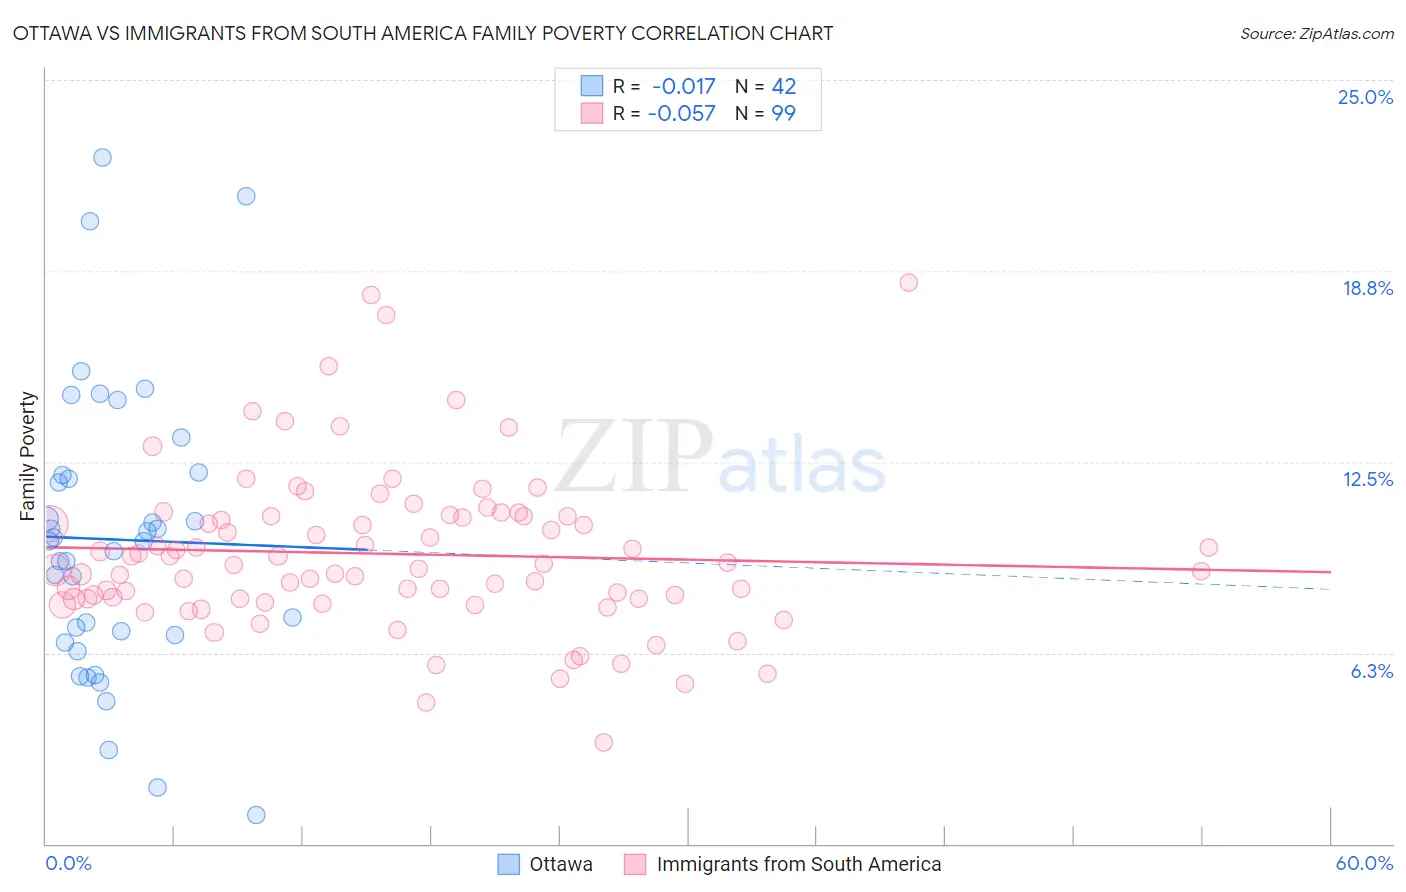
Ottawa vs Immigrants from South America Family Poverty Correlation Chart
The statistical analysis conducted on geographies consisting of 49,932,404 people shows no correlation between the proportion of Ottawa and poverty level among families in the United States with a correlation coefficient (R) of -0.017 and weighted average of 10.0%. Similarly, the statistical analysis conducted on geographies consisting of 484,267,691 people shows a slight negative correlation between the proportion of Immigrants from South America and poverty level among families in the United States with a correlation coefficient (R) of -0.057 and weighted average of 9.5%, a difference of 5.8%.
Family Poverty Correlation Summary
| Measurement | Ottawa | Immigrants from South America |
| Minimum | 0.96% | 3.3% |
| Maximum | 22.5% | 18.4% |
| Range | 21.5% | 15.1% |
| Mean | 10.0% | 9.5% |
| Median | 9.9% | 9.1% |
| Interquartile 25% (IQ1) | 6.8% | 8.0% |
| Interquartile 75% (IQ3) | 12.1% | 10.7% |
| Interquartile Range (IQR) | 5.2% | 2.7% |
| Standard Deviation (Sample) | 4.7% | 2.6% |
| Standard Deviation (Population) | 4.7% | 2.6% |
Demographics Similar to Ottawa and Immigrants from South America by Family Poverty
In terms of family poverty, the demographic groups most similar to Ottawa are Immigrants (10.0%, a difference of 0.27%), Marshallese (9.9%, a difference of 0.52%), Immigrants from Africa (9.9%, a difference of 0.82%), Japanese (9.9%, a difference of 1.1%), and Immigrants from Cambodia (9.9%, a difference of 1.2%). Similarly, the demographic groups most similar to Immigrants from South America are Sierra Leonean (9.5%, a difference of 0.53%), Immigrants from Eastern Africa (9.5%, a difference of 0.64%), Immigrants from Uruguay (9.5%, a difference of 0.93%), Alsatian (9.6%, a difference of 1.7%), and Malaysian (9.6%, a difference of 1.9%).
| Demographics | Rating | Rank | Family Poverty |
| Immigrants | South America | 18.0 /100 | #206 | Poor 9.5% |
| Sierra Leoneans | 15.6 /100 | #207 | Poor 9.5% |
| Immigrants | Eastern Africa | 15.1 /100 | #208 | Poor 9.5% |
| Immigrants | Uruguay | 14.0 /100 | #209 | Poor 9.5% |
| Alsatians | 11.3 /100 | #210 | Poor 9.6% |
| Malaysians | 10.6 /100 | #211 | Poor 9.6% |
| Immigrants | Thailand | 9.7 /100 | #212 | Tragic 9.7% |
| Osage | 8.0 /100 | #213 | Tragic 9.7% |
| Immigrants | Micronesia | 6.7 /100 | #214 | Tragic 9.8% |
| Immigrants | Nonimmigrants | 6.7 /100 | #215 | Tragic 9.8% |
| Moroccans | 6.5 /100 | #216 | Tragic 9.8% |
| Americans | 6.2 /100 | #217 | Tragic 9.8% |
| Panamanians | 5.6 /100 | #218 | Tragic 9.8% |
| Immigrants | Eritrea | 5.4 /100 | #219 | Tragic 9.9% |
| Bermudans | 5.3 /100 | #220 | Tragic 9.9% |
| Immigrants | Cambodia | 4.8 /100 | #221 | Tragic 9.9% |
| Japanese | 4.8 /100 | #222 | Tragic 9.9% |
| Immigrants | Africa | 4.3 /100 | #223 | Tragic 9.9% |
| Marshallese | 3.9 /100 | #224 | Tragic 9.9% |
| Immigrants | Immigrants | 3.6 /100 | #225 | Tragic 10.0% |
| Ottawa | 3.3 /100 | #226 | Tragic 10.0% |