Burmese vs French American Indian Receiving Food Stamps
COMPARE
Burmese
French American Indian
Receiving Food Stamps
Receiving Food Stamps Comparison
Burmese
French American Indians
8.6%
RECEIVING FOOD STAMPS
99.9/ 100
METRIC RATING
8th/ 347
METRIC RANK
13.5%
RECEIVING FOOD STAMPS
1.4/ 100
METRIC RATING
238th/ 347
METRIC RANK
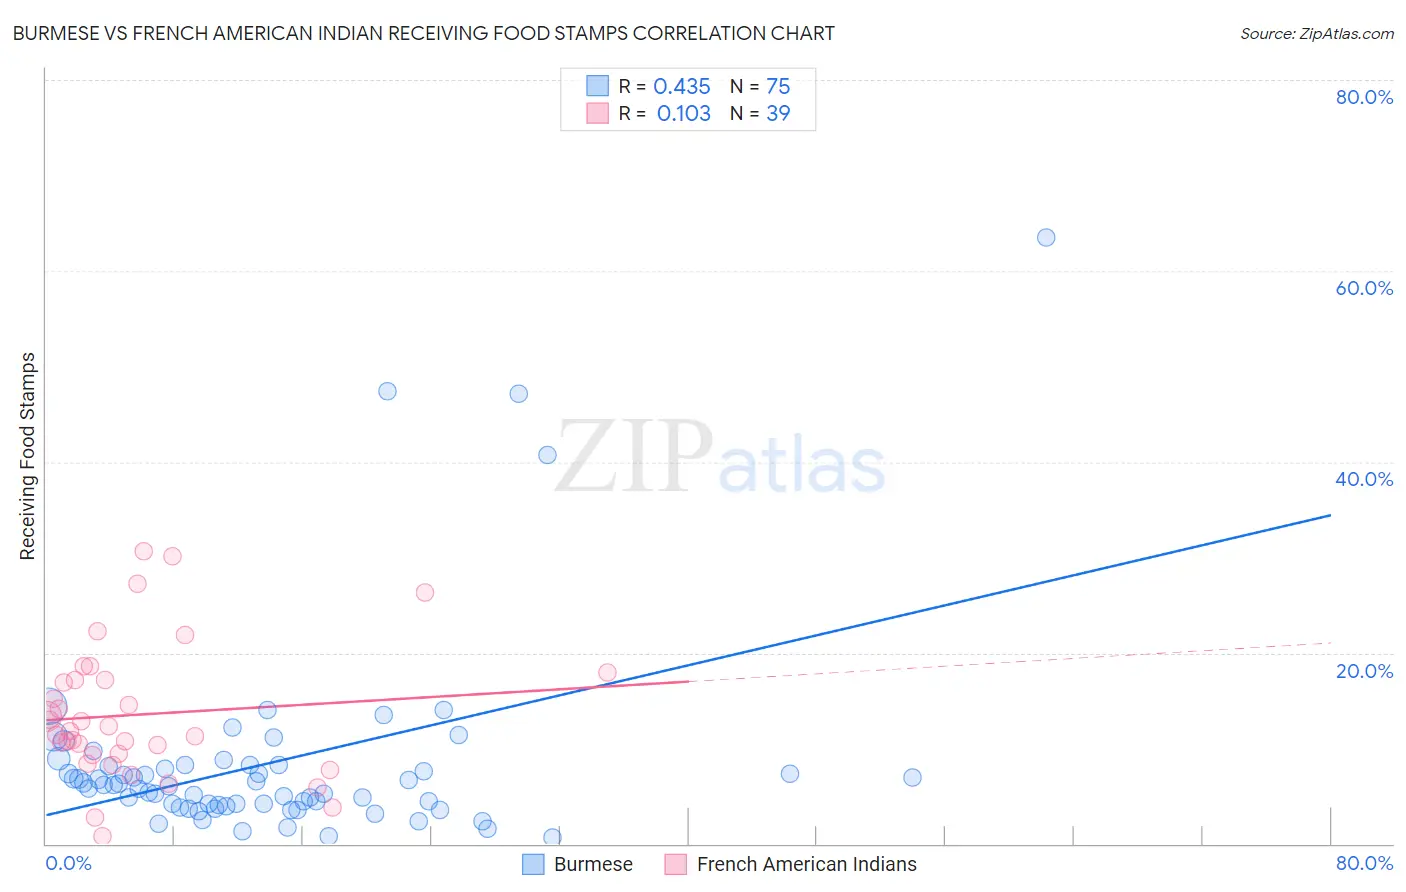
Burmese vs French American Indian Receiving Food Stamps Correlation Chart
The statistical analysis conducted on geographies consisting of 463,413,617 people shows a moderate positive correlation between the proportion of Burmese and percentage of population receiving government assistance and/or food stamps in the United States with a correlation coefficient (R) of 0.435 and weighted average of 8.6%. Similarly, the statistical analysis conducted on geographies consisting of 131,914,702 people shows a poor positive correlation between the proportion of French American Indians and percentage of population receiving government assistance and/or food stamps in the United States with a correlation coefficient (R) of 0.103 and weighted average of 13.5%, a difference of 55.8%.
Receiving Food Stamps Correlation Summary
| Measurement | Burmese | French American Indian |
| Minimum | 0.70% | 0.80% |
| Maximum | 63.5% | 30.7% |
| Range | 62.8% | 29.9% |
| Mean | 8.5% | 13.5% |
| Median | 6.1% | 11.8% |
| Interquartile 25% (IQ1) | 4.1% | 9.3% |
| Interquartile 75% (IQ3) | 8.3% | 17.1% |
| Interquartile Range (IQR) | 4.2% | 7.8% |
| Standard Deviation (Sample) | 10.5% | 7.0% |
| Standard Deviation (Population) | 10.4% | 7.0% |
Similar Demographics by Receiving Food Stamps
Demographics Similar to Burmese by Receiving Food Stamps
In terms of receiving food stamps, the demographic groups most similar to Burmese are Immigrants from Korea (8.7%, a difference of 0.16%), Immigrants from South Central Asia (8.8%, a difference of 2.1%), Okinawan (8.9%, a difference of 2.5%), Cypriot (8.9%, a difference of 2.6%), and Bulgarian (8.9%, a difference of 2.8%).
| Demographics | Rating | Rank | Receiving Food Stamps |
| Immigrants | Taiwan | 100.0 /100 | #1 | Exceptional 7.3% |
| Immigrants | India | 100.0 /100 | #2 | Exceptional 7.4% |
| Filipinos | 100.0 /100 | #3 | Exceptional 7.4% |
| Iranians | 100.0 /100 | #4 | Exceptional 7.9% |
| Thais | 100.0 /100 | #5 | Exceptional 8.1% |
| Immigrants | Singapore | 100.0 /100 | #6 | Exceptional 8.3% |
| Immigrants | Iran | 100.0 /100 | #7 | Exceptional 8.3% |
| Burmese | 99.9 /100 | #8 | Exceptional 8.6% |
| Immigrants | Korea | 99.9 /100 | #9 | Exceptional 8.7% |
| Immigrants | South Central Asia | 99.9 /100 | #10 | Exceptional 8.8% |
| Okinawans | 99.9 /100 | #11 | Exceptional 8.9% |
| Cypriots | 99.9 /100 | #12 | Exceptional 8.9% |
| Bulgarians | 99.9 /100 | #13 | Exceptional 8.9% |
| Maltese | 99.9 /100 | #14 | Exceptional 8.9% |
| Norwegians | 99.9 /100 | #15 | Exceptional 9.0% |
Demographics Similar to French American Indians by Receiving Food Stamps
In terms of receiving food stamps, the demographic groups most similar to French American Indians are Immigrants from El Salvador (13.5%, a difference of 0.20%), Immigrants from Micronesia (13.5%, a difference of 0.23%), Crow (13.4%, a difference of 0.42%), Iroquois (13.5%, a difference of 0.53%), and Immigrants from Zaire (13.4%, a difference of 0.87%).
| Demographics | Rating | Rank | Receiving Food Stamps |
| Immigrants | Nigeria | 3.4 /100 | #231 | Tragic 13.1% |
| Salvadorans | 2.7 /100 | #232 | Tragic 13.2% |
| Cherokee | 2.5 /100 | #233 | Tragic 13.2% |
| Comanche | 2.4 /100 | #234 | Tragic 13.3% |
| Immigrants | Zaire | 1.9 /100 | #235 | Tragic 13.4% |
| Crow | 1.6 /100 | #236 | Tragic 13.4% |
| Immigrants | El Salvador | 1.5 /100 | #237 | Tragic 13.5% |
| French American Indians | 1.4 /100 | #238 | Tragic 13.5% |
| Immigrants | Micronesia | 1.3 /100 | #239 | Tragic 13.5% |
| Iroquois | 1.2 /100 | #240 | Tragic 13.5% |
| Choctaw | 1.0 /100 | #241 | Tragic 13.6% |
| Immigrants | Panama | 1.0 /100 | #242 | Tragic 13.6% |
| Somalis | 0.9 /100 | #243 | Tragic 13.7% |
| Cajuns | 0.9 /100 | #244 | Tragic 13.7% |
| Immigrants | Somalia | 0.9 /100 | #245 | Tragic 13.7% |