British West Indian vs Crow Median Household Income
COMPARE
British West Indian
Crow
Median Household Income
Median Household Income Comparison
British West Indians
Crow
$75,647
MEDIAN HOUSEHOLD INCOME
0.2/ 100
METRIC RATING
274th/ 347
METRIC RANK
$63,681
MEDIAN HOUSEHOLD INCOME
0.0/ 100
METRIC RATING
341st/ 347
METRIC RANK
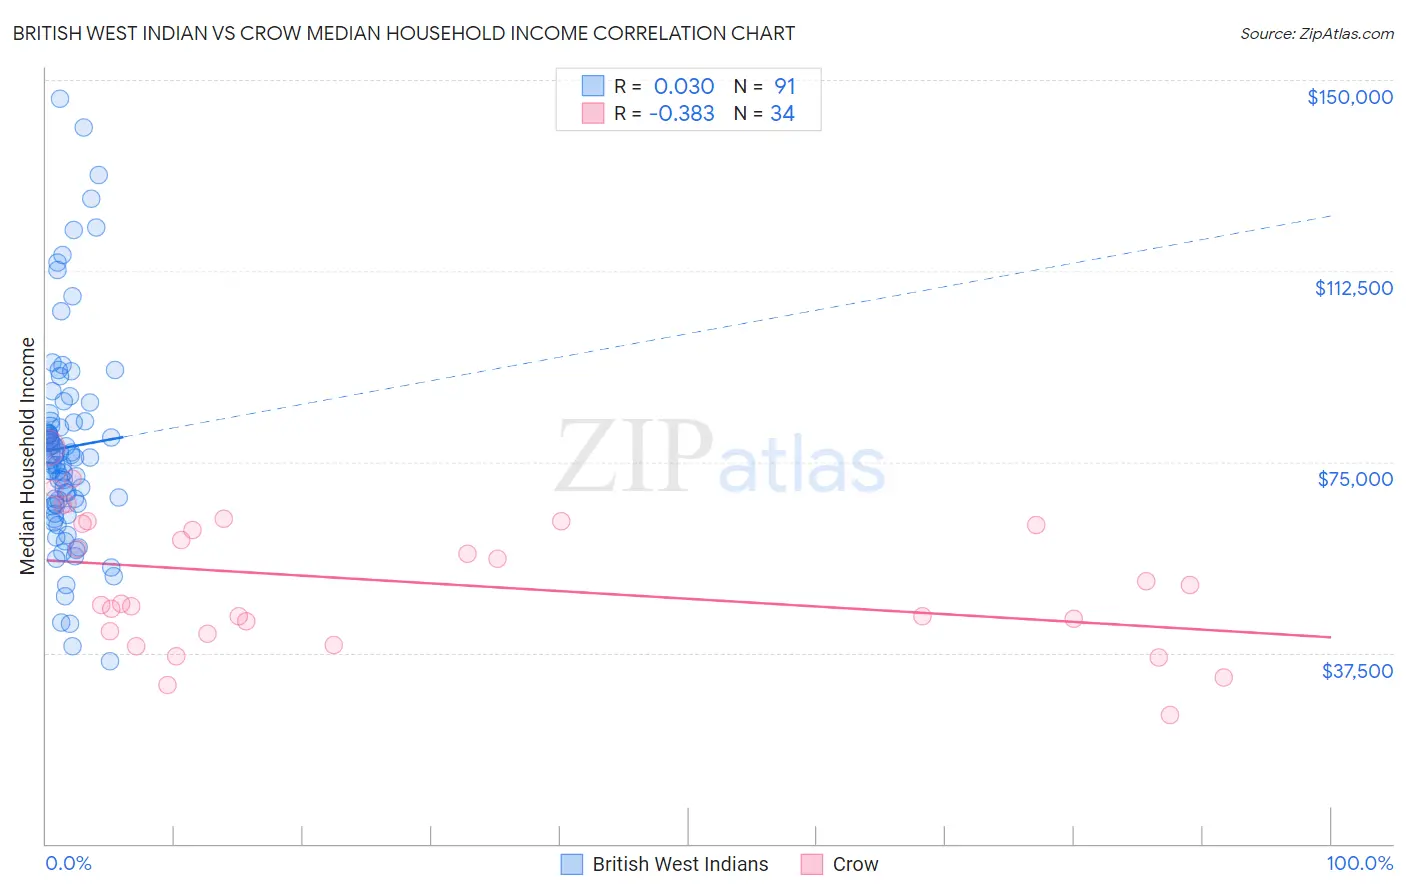
British West Indian vs Crow Median Household Income Correlation Chart
The statistical analysis conducted on geographies consisting of 152,617,098 people shows no correlation between the proportion of British West Indians and median household income in the United States with a correlation coefficient (R) of 0.030 and weighted average of $75,647. Similarly, the statistical analysis conducted on geographies consisting of 59,197,360 people shows a mild negative correlation between the proportion of Crow and median household income in the United States with a correlation coefficient (R) of -0.383 and weighted average of $63,681, a difference of 18.8%.
Median Household Income Correlation Summary
| Measurement | British West Indian | Crow |
| Minimum | $35,840 | $25,179 |
| Maximum | $146,303 | $77,725 |
| Range | $110,463 | $52,546 |
| Mean | $77,834 | $51,476 |
| Median | $75,947 | $48,948 |
| Interquartile 25% (IQ1) | $66,444 | $41,650 |
| Interquartile 75% (IQ3) | $83,003 | $62,906 |
| Interquartile Range (IQR) | $16,558 | $21,256 |
| Standard Deviation (Sample) | $20,857 | $12,984 |
| Standard Deviation (Population) | $20,742 | $12,792 |
Similar Demographics by Median Household Income
Demographics Similar to British West Indians by Median Household Income
In terms of median household income, the demographic groups most similar to British West Indians are Liberian ($75,667, a difference of 0.030%), Immigrants from Micronesia ($75,574, a difference of 0.10%), Somali ($75,782, a difference of 0.18%), Pennsylvania German ($75,814, a difference of 0.22%), and Hmong ($75,839, a difference of 0.25%).
| Demographics | Rating | Rank | Median Household Income |
| German Russians | 0.3 /100 | #267 | Tragic $75,856 |
| Immigrants | Jamaica | 0.3 /100 | #268 | Tragic $75,851 |
| Cape Verdeans | 0.3 /100 | #269 | Tragic $75,848 |
| Hmong | 0.3 /100 | #270 | Tragic $75,839 |
| Pennsylvania Germans | 0.3 /100 | #271 | Tragic $75,814 |
| Somalis | 0.3 /100 | #272 | Tragic $75,782 |
| Liberians | 0.2 /100 | #273 | Tragic $75,667 |
| British West Indians | 0.2 /100 | #274 | Tragic $75,647 |
| Immigrants | Micronesia | 0.2 /100 | #275 | Tragic $75,574 |
| Immigrants | Latin America | 0.2 /100 | #276 | Tragic $75,420 |
| Spanish Americans | 0.2 /100 | #277 | Tragic $75,386 |
| Osage | 0.2 /100 | #278 | Tragic $75,240 |
| Immigrants | Guatemala | 0.2 /100 | #279 | Tragic $75,123 |
| Senegalese | 0.2 /100 | #280 | Tragic $74,999 |
| Immigrants | Liberia | 0.1 /100 | #281 | Tragic $74,896 |
Demographics Similar to Crow by Median Household Income
In terms of median household income, the demographic groups most similar to Crow are Pima ($63,262, a difference of 0.66%), Pueblo ($64,692, a difference of 1.6%), Houma ($62,575, a difference of 1.8%), Hopi ($65,043, a difference of 2.1%), and Immigrants from Yemen ($65,194, a difference of 2.4%).
| Demographics | Rating | Rank | Median Household Income |
| Creek | 0.0 /100 | #333 | Tragic $67,715 |
| Blacks/African Americans | 0.0 /100 | #334 | Tragic $67,573 |
| Cheyenne | 0.0 /100 | #335 | Tragic $66,974 |
| Immigrants | Congo | 0.0 /100 | #336 | Tragic $66,768 |
| Kiowa | 0.0 /100 | #337 | Tragic $65,914 |
| Immigrants | Yemen | 0.0 /100 | #338 | Tragic $65,194 |
| Hopi | 0.0 /100 | #339 | Tragic $65,043 |
| Pueblo | 0.0 /100 | #340 | Tragic $64,692 |
| Crow | 0.0 /100 | #341 | Tragic $63,681 |
| Pima | 0.0 /100 | #342 | Tragic $63,262 |
| Houma | 0.0 /100 | #343 | Tragic $62,575 |
| Tohono O'odham | 0.0 /100 | #344 | Tragic $61,663 |
| Puerto Ricans | 0.0 /100 | #345 | Tragic $59,197 |
| Navajo | 0.0 /100 | #346 | Tragic $59,159 |
| Lumbee | 0.0 /100 | #347 | Tragic $54,644 |