British vs Osage Child Poverty Under the Age of 5
COMPARE
British
Osage
Child Poverty Under the Age of 5
Child Poverty Under the Age of 5 Comparison
British
Osage
16.3%
CHILD POVERTY UNDER THE AGE OF 5
89.4/ 100
METRIC RATING
129th/ 347
METRIC RANK
19.6%
CHILD POVERTY UNDER THE AGE OF 5
0.5/ 100
METRIC RATING
243rd/ 347
METRIC RANK
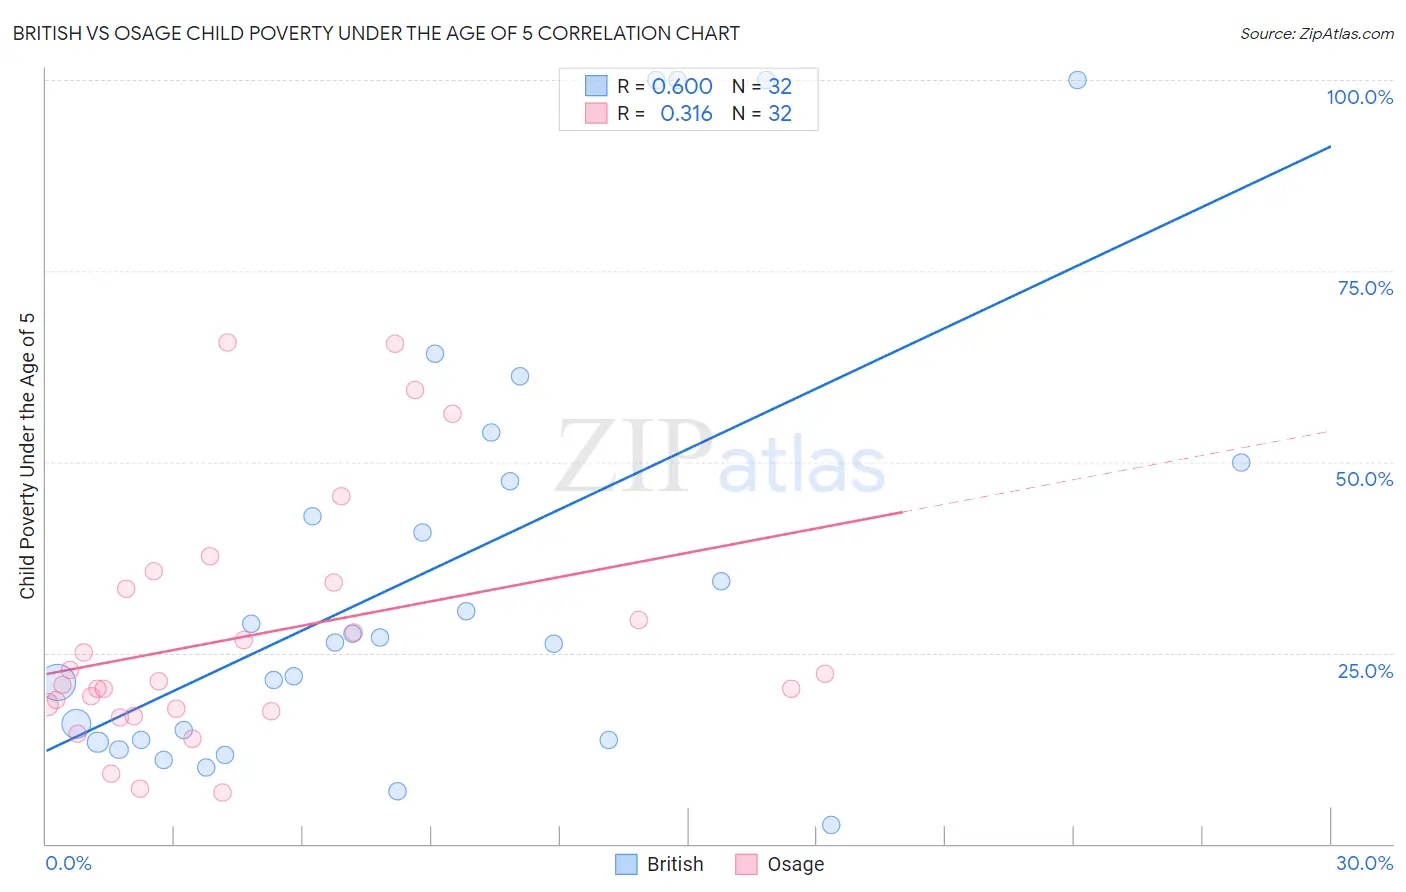
British vs Osage Child Poverty Under the Age of 5 Correlation Chart
The statistical analysis conducted on geographies consisting of 499,115,764 people shows a substantial positive correlation between the proportion of British and poverty level among children under the age of 5 in the United States with a correlation coefficient (R) of 0.600 and weighted average of 16.3%. Similarly, the statistical analysis conducted on geographies consisting of 90,936,218 people shows a mild positive correlation between the proportion of Osage and poverty level among children under the age of 5 in the United States with a correlation coefficient (R) of 0.316 and weighted average of 19.6%, a difference of 20.7%.
Child Poverty Under the Age of 5 Correlation Summary
| Measurement | British | Osage |
| Minimum | 2.4% | 6.7% |
| Maximum | 100.0% | 65.6% |
| Range | 97.6% | 59.0% |
| Mean | 36.0% | 27.0% |
| Median | 26.7% | 21.0% |
| Interquartile 25% (IQ1) | 13.6% | 17.5% |
| Interquartile 75% (IQ3) | 48.7% | 33.8% |
| Interquartile Range (IQR) | 35.1% | 16.2% |
| Standard Deviation (Sample) | 29.2% | 15.9% |
| Standard Deviation (Population) | 28.7% | 15.6% |
Similar Demographics by Child Poverty Under the Age of 5
Demographics Similar to British by Child Poverty Under the Age of 5
In terms of child poverty under the age of 5, the demographic groups most similar to British are Immigrants from Norway (16.3%, a difference of 0.030%), South African (16.2%, a difference of 0.18%), Finnish (16.3%, a difference of 0.32%), Serbian (16.3%, a difference of 0.35%), and Icelander (16.3%, a difference of 0.42%).
| Demographics | Rating | Rank | Child Poverty Under the Age of 5 |
| Immigrants | Southern Europe | 92.0 /100 | #122 | Exceptional 16.1% |
| Austrians | 92.0 /100 | #123 | Exceptional 16.1% |
| Swiss | 92.0 /100 | #124 | Exceptional 16.1% |
| Native Hawaiians | 91.8 /100 | #125 | Exceptional 16.2% |
| Immigrants | Albania | 91.8 /100 | #126 | Exceptional 16.2% |
| Immigrants | England | 91.5 /100 | #127 | Exceptional 16.2% |
| South Africans | 90.1 /100 | #128 | Exceptional 16.2% |
| British | 89.4 /100 | #129 | Excellent 16.3% |
| Immigrants | Norway | 89.3 /100 | #130 | Excellent 16.3% |
| Finns | 88.3 /100 | #131 | Excellent 16.3% |
| Serbians | 88.2 /100 | #132 | Excellent 16.3% |
| Icelanders | 87.9 /100 | #133 | Excellent 16.3% |
| Immigrants | North Macedonia | 87.8 /100 | #134 | Excellent 16.4% |
| Brazilians | 87.8 /100 | #135 | Excellent 16.4% |
| Immigrants | Northern Africa | 87.5 /100 | #136 | Excellent 16.4% |
Demographics Similar to Osage by Child Poverty Under the Age of 5
In terms of child poverty under the age of 5, the demographic groups most similar to Osage are Immigrants from Ghana (19.6%, a difference of 0.020%), Immigrants from Guyana (19.6%, a difference of 0.10%), Immigrants from Western Africa (19.7%, a difference of 0.21%), Alaska Native (19.6%, a difference of 0.22%), and Immigrants from Ecuador (19.6%, a difference of 0.28%).
| Demographics | Rating | Rank | Child Poverty Under the Age of 5 |
| Immigrants | Trinidad and Tobago | 0.8 /100 | #236 | Tragic 19.4% |
| Immigrants | Cabo Verde | 0.6 /100 | #237 | Tragic 19.5% |
| Salvadorans | 0.6 /100 | #238 | Tragic 19.5% |
| Vietnamese | 0.6 /100 | #239 | Tragic 19.5% |
| Immigrants | Ecuador | 0.5 /100 | #240 | Tragic 19.6% |
| Alaska Natives | 0.5 /100 | #241 | Tragic 19.6% |
| Immigrants | Guyana | 0.5 /100 | #242 | Tragic 19.6% |
| Osage | 0.5 /100 | #243 | Tragic 19.6% |
| Immigrants | Ghana | 0.5 /100 | #244 | Tragic 19.6% |
| Immigrants | Western Africa | 0.4 /100 | #245 | Tragic 19.7% |
| Cree | 0.4 /100 | #246 | Tragic 19.7% |
| Guyanese | 0.4 /100 | #247 | Tragic 19.7% |
| Marshallese | 0.4 /100 | #248 | Tragic 19.7% |
| Immigrants | Middle Africa | 0.4 /100 | #249 | Tragic 19.7% |
| Immigrants | Nonimmigrants | 0.4 /100 | #250 | Tragic 19.7% |