British vs Spanish American Child Poverty Under the Age of 5
COMPARE
British
Spanish American
Child Poverty Under the Age of 5
Child Poverty Under the Age of 5 Comparison
British
Spanish Americans
16.3%
CHILD POVERTY UNDER THE AGE OF 5
89.4/ 100
METRIC RATING
129th/ 347
METRIC RANK
20.1%
CHILD POVERTY UNDER THE AGE OF 5
0.2/ 100
METRIC RATING
260th/ 347
METRIC RANK
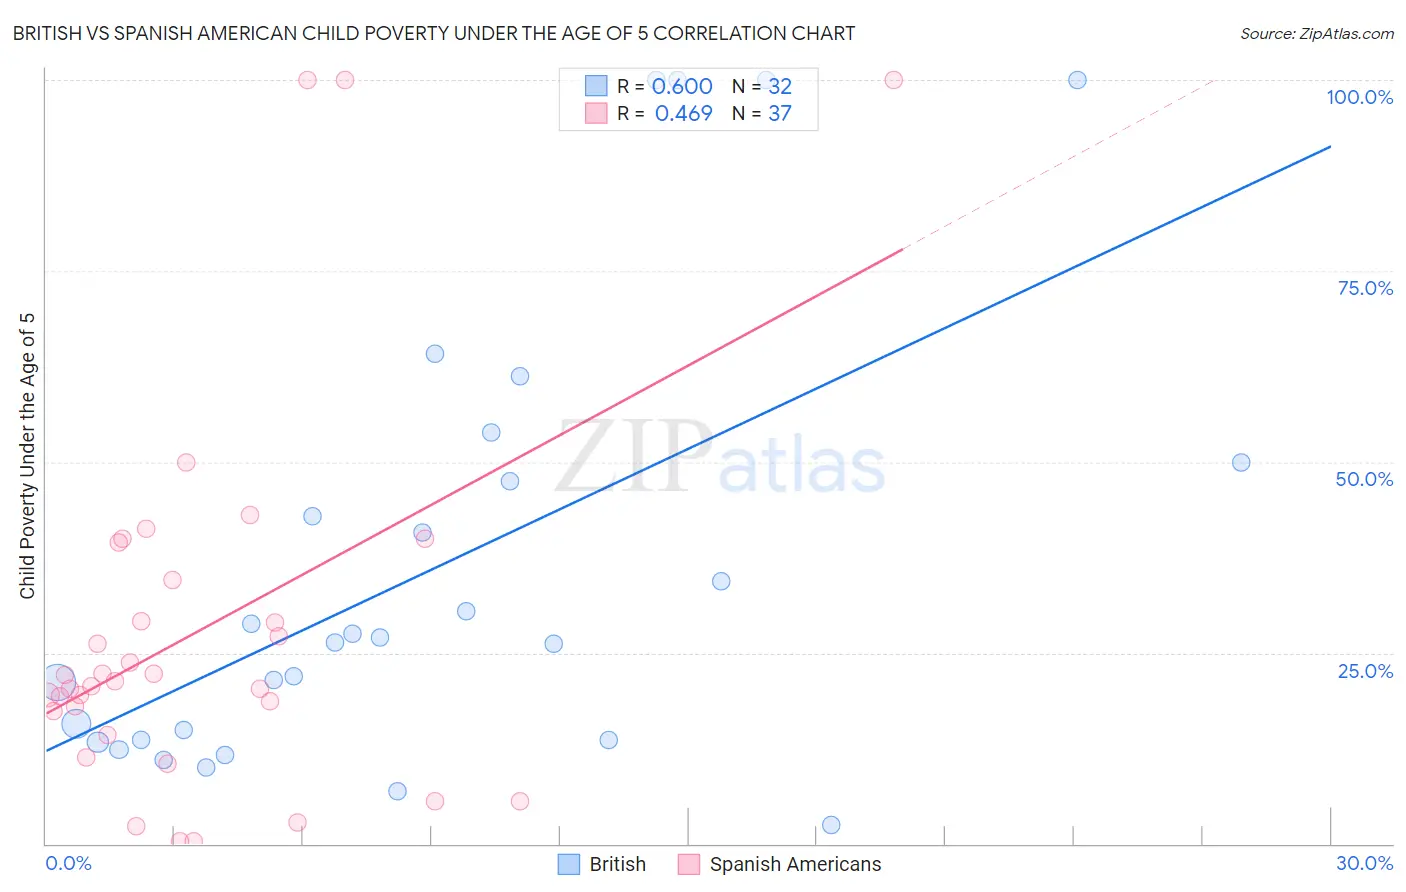
British vs Spanish American Child Poverty Under the Age of 5 Correlation Chart
The statistical analysis conducted on geographies consisting of 499,115,764 people shows a substantial positive correlation between the proportion of British and poverty level among children under the age of 5 in the United States with a correlation coefficient (R) of 0.600 and weighted average of 16.3%. Similarly, the statistical analysis conducted on geographies consisting of 102,323,940 people shows a moderate positive correlation between the proportion of Spanish Americans and poverty level among children under the age of 5 in the United States with a correlation coefficient (R) of 0.469 and weighted average of 20.1%, a difference of 23.4%.
Child Poverty Under the Age of 5 Correlation Summary
| Measurement | British | Spanish American |
| Minimum | 2.4% | 0.35% |
| Maximum | 100.0% | 100.0% |
| Range | 97.6% | 99.6% |
| Mean | 36.0% | 28.1% |
| Median | 26.7% | 21.3% |
| Interquartile 25% (IQ1) | 13.6% | 15.8% |
| Interquartile 75% (IQ3) | 48.7% | 37.0% |
| Interquartile Range (IQR) | 35.1% | 21.1% |
| Standard Deviation (Sample) | 29.2% | 24.9% |
| Standard Deviation (Population) | 28.7% | 24.6% |
Similar Demographics by Child Poverty Under the Age of 5
Demographics Similar to British by Child Poverty Under the Age of 5
In terms of child poverty under the age of 5, the demographic groups most similar to British are Immigrants from Norway (16.3%, a difference of 0.030%), South African (16.2%, a difference of 0.18%), Finnish (16.3%, a difference of 0.32%), Serbian (16.3%, a difference of 0.35%), and Icelander (16.3%, a difference of 0.42%).
| Demographics | Rating | Rank | Child Poverty Under the Age of 5 |
| Immigrants | Southern Europe | 92.0 /100 | #122 | Exceptional 16.1% |
| Austrians | 92.0 /100 | #123 | Exceptional 16.1% |
| Swiss | 92.0 /100 | #124 | Exceptional 16.1% |
| Native Hawaiians | 91.8 /100 | #125 | Exceptional 16.2% |
| Immigrants | Albania | 91.8 /100 | #126 | Exceptional 16.2% |
| Immigrants | England | 91.5 /100 | #127 | Exceptional 16.2% |
| South Africans | 90.1 /100 | #128 | Exceptional 16.2% |
| British | 89.4 /100 | #129 | Excellent 16.3% |
| Immigrants | Norway | 89.3 /100 | #130 | Excellent 16.3% |
| Finns | 88.3 /100 | #131 | Excellent 16.3% |
| Serbians | 88.2 /100 | #132 | Excellent 16.3% |
| Icelanders | 87.9 /100 | #133 | Excellent 16.3% |
| Immigrants | North Macedonia | 87.8 /100 | #134 | Excellent 16.4% |
| Brazilians | 87.8 /100 | #135 | Excellent 16.4% |
| Immigrants | Northern Africa | 87.5 /100 | #136 | Excellent 16.4% |
Demographics Similar to Spanish Americans by Child Poverty Under the Age of 5
In terms of child poverty under the age of 5, the demographic groups most similar to Spanish Americans are Immigrants from Bangladesh (20.1%, a difference of 0.040%), Immigrants from El Salvador (20.0%, a difference of 0.40%), Immigrants from St. Vincent and the Grenadines (20.0%, a difference of 0.43%), Liberian (20.2%, a difference of 0.45%), and Barbadian (20.2%, a difference of 0.51%).
| Demographics | Rating | Rank | Child Poverty Under the Age of 5 |
| Mexican American Indians | 0.3 /100 | #253 | Tragic 19.9% |
| Fijians | 0.3 /100 | #254 | Tragic 19.9% |
| Immigrants | Cuba | 0.2 /100 | #255 | Tragic 19.9% |
| Immigrants | Barbados | 0.2 /100 | #256 | Tragic 20.0% |
| Shoshone | 0.2 /100 | #257 | Tragic 20.0% |
| Immigrants | St. Vincent and the Grenadines | 0.2 /100 | #258 | Tragic 20.0% |
| Immigrants | El Salvador | 0.2 /100 | #259 | Tragic 20.0% |
| Spanish Americans | 0.2 /100 | #260 | Tragic 20.1% |
| Immigrants | Bangladesh | 0.2 /100 | #261 | Tragic 20.1% |
| Liberians | 0.1 /100 | #262 | Tragic 20.2% |
| Barbadians | 0.1 /100 | #263 | Tragic 20.2% |
| Immigrants | Liberia | 0.1 /100 | #264 | Tragic 20.2% |
| Spanish American Indians | 0.1 /100 | #265 | Tragic 20.2% |
| Aleuts | 0.1 /100 | #266 | Tragic 20.3% |
| Ottawa | 0.1 /100 | #267 | Tragic 20.3% |