Immigrants from Fiji vs Welsh Single Male Poverty
COMPARE
Immigrants from Fiji
Welsh
Single Male Poverty
Single Male Poverty Comparison
Immigrants from Fiji
Welsh
10.9%
SINGLE MALE POVERTY
100.0/ 100
METRIC RATING
10th/ 347
METRIC RANK
14.0%
SINGLE MALE POVERTY
0.1/ 100
METRIC RATING
273rd/ 347
METRIC RANK
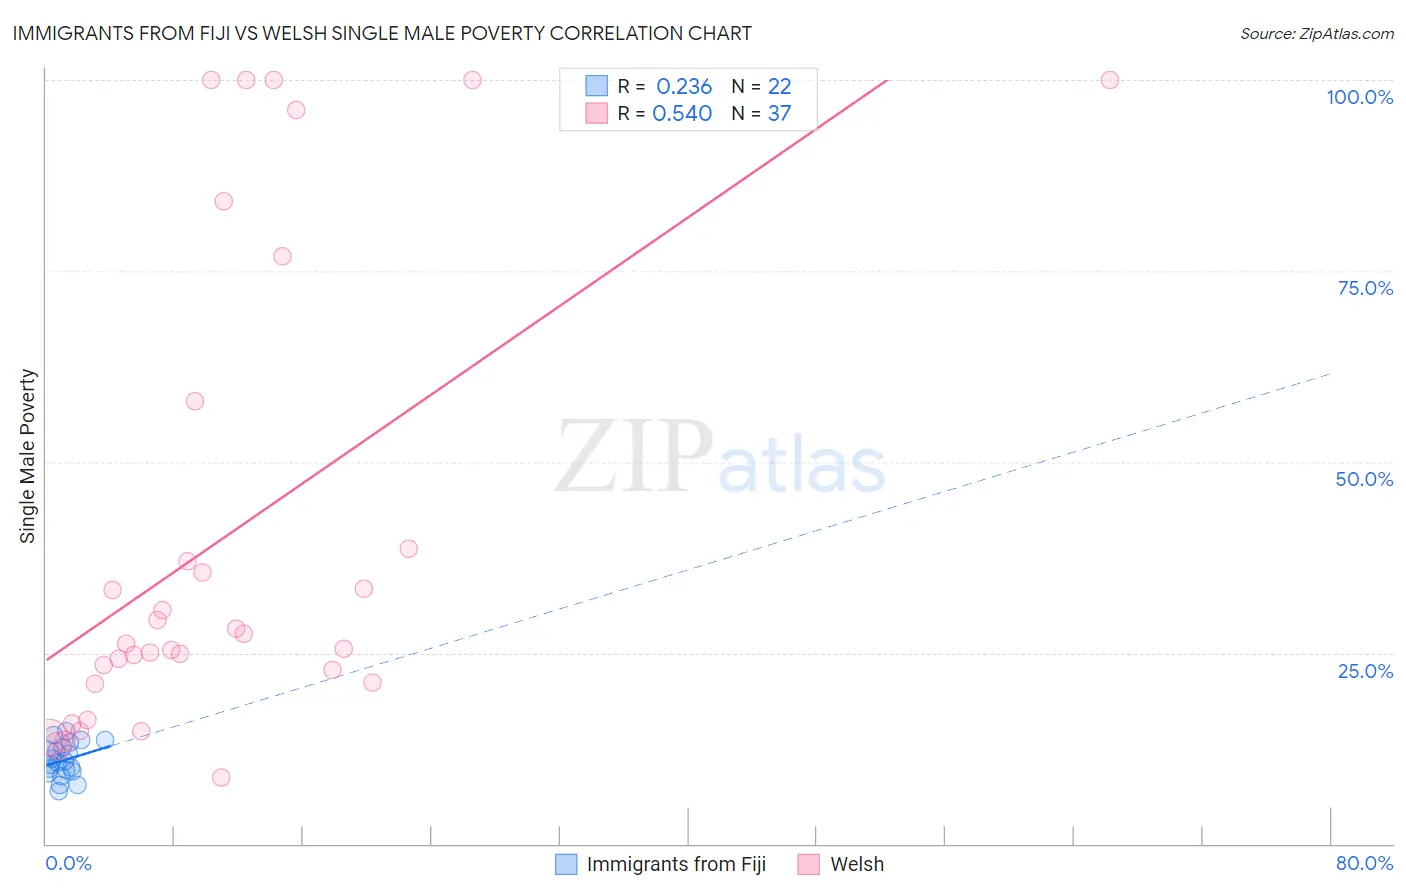
Immigrants from Fiji vs Welsh Single Male Poverty Correlation Chart
The statistical analysis conducted on geographies consisting of 90,653,076 people shows a weak positive correlation between the proportion of Immigrants from Fiji and poverty level among single males in the United States with a correlation coefficient (R) of 0.236 and weighted average of 10.9%. Similarly, the statistical analysis conducted on geographies consisting of 442,898,896 people shows a substantial positive correlation between the proportion of Welsh and poverty level among single males in the United States with a correlation coefficient (R) of 0.540 and weighted average of 14.0%, a difference of 28.8%.
Single Male Poverty Correlation Summary
| Measurement | Immigrants from Fiji | Welsh |
| Minimum | 6.8% | 8.7% |
| Maximum | 14.7% | 100.0% |
| Range | 7.9% | 91.3% |
| Mean | 10.9% | 40.1% |
| Median | 10.7% | 26.2% |
| Interquartile 25% (IQ1) | 9.5% | 21.0% |
| Interquartile 75% (IQ3) | 12.6% | 48.3% |
| Interquartile Range (IQR) | 3.1% | 27.3% |
| Standard Deviation (Sample) | 2.2% | 30.6% |
| Standard Deviation (Population) | 2.2% | 30.2% |
Similar Demographics by Single Male Poverty
Demographics Similar to Immigrants from Fiji by Single Male Poverty
In terms of single male poverty, the demographic groups most similar to Immigrants from Fiji are Immigrants from Philippines (10.9%, a difference of 0.020%), Taiwanese (10.9%, a difference of 0.050%), Immigrants from Afghanistan (10.9%, a difference of 0.090%), Immigrants from South Central Asia (10.9%, a difference of 0.22%), and Chinese (11.0%, a difference of 0.78%).
| Demographics | Rating | Rank | Single Male Poverty |
| Immigrants | India | 100.0 /100 | #3 | Exceptional 10.3% |
| Immigrants | Hong Kong | 100.0 /100 | #4 | Exceptional 10.4% |
| Tongans | 100.0 /100 | #5 | Exceptional 10.5% |
| Filipinos | 100.0 /100 | #6 | Exceptional 10.6% |
| Afghans | 100.0 /100 | #7 | Exceptional 10.7% |
| Thais | 100.0 /100 | #8 | Exceptional 10.8% |
| Taiwanese | 100.0 /100 | #9 | Exceptional 10.9% |
| Immigrants | Fiji | 100.0 /100 | #10 | Exceptional 10.9% |
| Immigrants | Philippines | 100.0 /100 | #11 | Exceptional 10.9% |
| Immigrants | Afghanistan | 100.0 /100 | #12 | Exceptional 10.9% |
| Immigrants | South Central Asia | 100.0 /100 | #13 | Exceptional 10.9% |
| Chinese | 100.0 /100 | #14 | Exceptional 11.0% |
| Koreans | 100.0 /100 | #15 | Exceptional 11.0% |
| Bhutanese | 100.0 /100 | #16 | Exceptional 11.1% |
| Tsimshian | 100.0 /100 | #17 | Exceptional 11.1% |
Demographics Similar to Welsh by Single Male Poverty
In terms of single male poverty, the demographic groups most similar to Welsh are Honduran (14.0%, a difference of 0.13%), English (14.1%, a difference of 0.21%), Dutch (14.1%, a difference of 0.32%), Mexican (14.0%, a difference of 0.35%), and Immigrants from Honduras (14.1%, a difference of 0.36%).
| Demographics | Rating | Rank | Single Male Poverty |
| Immigrants | Cabo Verde | 0.1 /100 | #266 | Tragic 13.9% |
| Germans | 0.1 /100 | #267 | Tragic 13.9% |
| Immigrants | Mexico | 0.1 /100 | #268 | Tragic 13.9% |
| Scottish | 0.1 /100 | #269 | Tragic 14.0% |
| Immigrants | Saudi Arabia | 0.1 /100 | #270 | Tragic 14.0% |
| Irish | 0.1 /100 | #271 | Tragic 14.0% |
| Mexicans | 0.1 /100 | #272 | Tragic 14.0% |
| Welsh | 0.1 /100 | #273 | Tragic 14.0% |
| Hondurans | 0.1 /100 | #274 | Tragic 14.0% |
| English | 0.1 /100 | #275 | Tragic 14.1% |
| Dutch | 0.1 /100 | #276 | Tragic 14.1% |
| Immigrants | Honduras | 0.0 /100 | #277 | Tragic 14.1% |
| Slovaks | 0.0 /100 | #278 | Tragic 14.1% |
| Indonesians | 0.0 /100 | #279 | Tragic 14.1% |
| Hmong | 0.0 /100 | #280 | Tragic 14.2% |