Houma vs Immigrants from India Child Poverty Under the Age of 16
COMPARE
Houma
Immigrants from India
Child Poverty Under the Age of 16
Child Poverty Under the Age of 16 Comparison
Houma
Immigrants from India
24.9%
CHILD POVERTY UNDER THE AGE OF 16
0.0/ 100
METRIC RATING
335th/ 347
METRIC RANK
10.8%
CHILD POVERTY UNDER THE AGE OF 16
100.0/ 100
METRIC RATING
1st/ 347
METRIC RANK
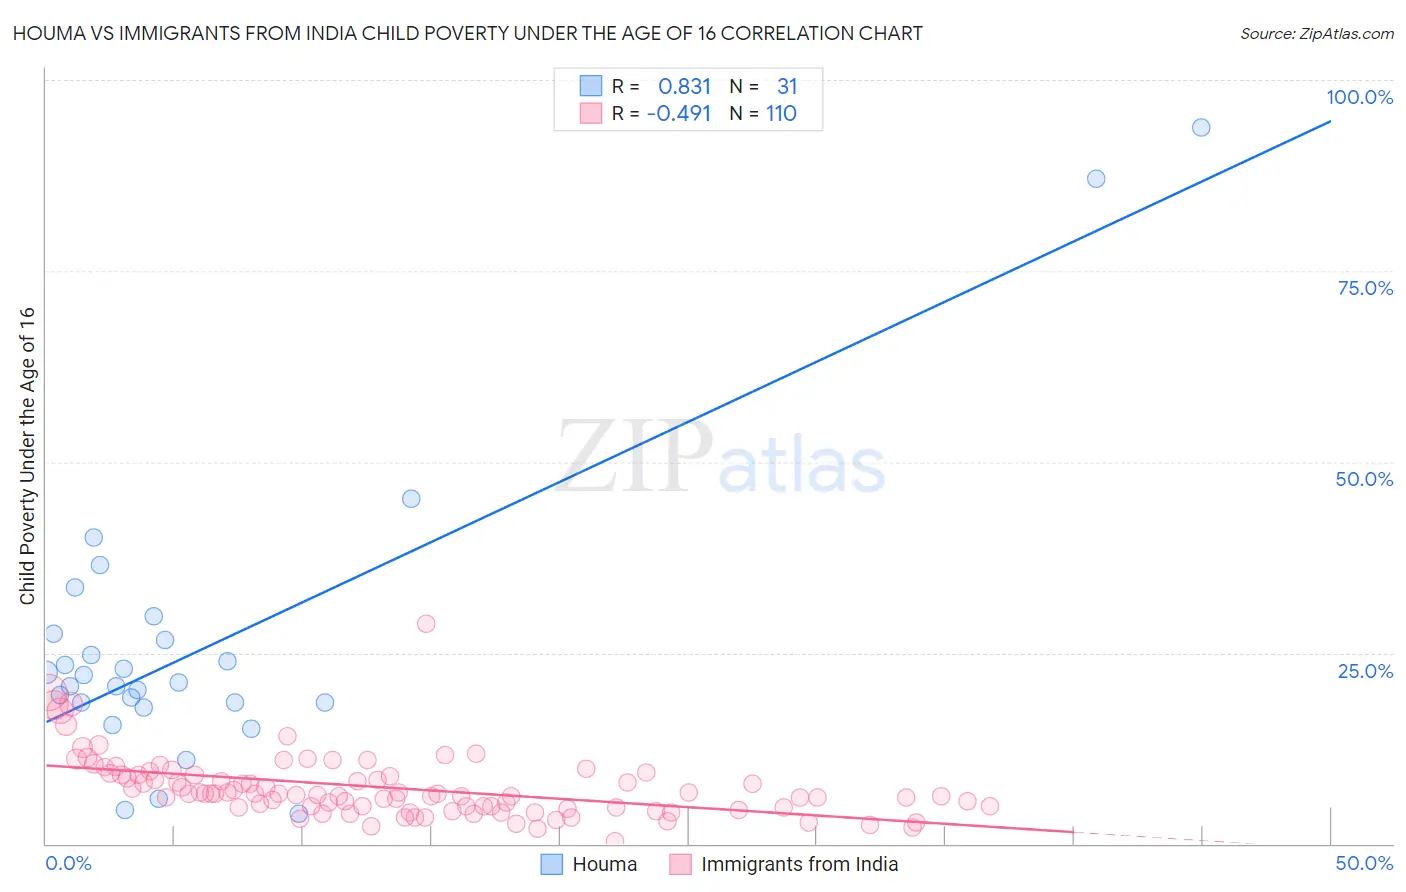
Houma vs Immigrants from India Child Poverty Under the Age of 16 Correlation Chart
The statistical analysis conducted on geographies consisting of 36,741,016 people shows a very strong positive correlation between the proportion of Houma and poverty level among children under the age of 16 in the United States with a correlation coefficient (R) of 0.831 and weighted average of 24.9%. Similarly, the statistical analysis conducted on geographies consisting of 429,036,351 people shows a moderate negative correlation between the proportion of Immigrants from India and poverty level among children under the age of 16 in the United States with a correlation coefficient (R) of -0.491 and weighted average of 10.8%, a difference of 130.8%.
Child Poverty Under the Age of 16 Correlation Summary
| Measurement | Houma | Immigrants from India |
| Minimum | 3.9% | 0.35% |
| Maximum | 93.9% | 28.8% |
| Range | 89.9% | 28.4% |
| Mean | 26.1% | 7.3% |
| Median | 21.1% | 6.5% |
| Interquartile 25% (IQ1) | 18.5% | 4.8% |
| Interquartile 75% (IQ3) | 27.6% | 9.1% |
| Interquartile Range (IQR) | 9.1% | 4.2% |
| Standard Deviation (Sample) | 19.5% | 4.1% |
| Standard Deviation (Population) | 19.2% | 4.1% |
Similar Demographics by Child Poverty Under the Age of 16
Demographics Similar to Houma by Child Poverty Under the Age of 16
In terms of child poverty under the age of 16, the demographic groups most similar to Houma are Yup'ik (25.1%, a difference of 1.1%), Sioux (25.2%, a difference of 1.4%), Black/African American (24.4%, a difference of 1.7%), Cheyenne (25.4%, a difference of 2.1%), and Immigrants from Dominican Republic (24.0%, a difference of 3.7%).
| Demographics | Rating | Rank | Child Poverty Under the Age of 16 |
| Colville | 0.0 /100 | #328 | Tragic 23.0% |
| Dominicans | 0.0 /100 | #329 | Tragic 23.8% |
| Natives/Alaskans | 0.0 /100 | #330 | Tragic 23.8% |
| Apache | 0.0 /100 | #331 | Tragic 23.8% |
| Pueblo | 0.0 /100 | #332 | Tragic 23.9% |
| Immigrants | Dominican Republic | 0.0 /100 | #333 | Tragic 24.0% |
| Blacks/African Americans | 0.0 /100 | #334 | Tragic 24.4% |
| Houma | 0.0 /100 | #335 | Tragic 24.9% |
| Yup'ik | 0.0 /100 | #336 | Tragic 25.1% |
| Sioux | 0.0 /100 | #337 | Tragic 25.2% |
| Cheyenne | 0.0 /100 | #338 | Tragic 25.4% |
| Crow | 0.0 /100 | #339 | Tragic 26.0% |
| Hopi | 0.0 /100 | #340 | Tragic 27.1% |
| Yuman | 0.0 /100 | #341 | Tragic 28.9% |
| Pima | 0.0 /100 | #342 | Tragic 29.0% |
Demographics Similar to Immigrants from India by Child Poverty Under the Age of 16
In terms of child poverty under the age of 16, the demographic groups most similar to Immigrants from India are Immigrants from Taiwan (11.0%, a difference of 2.5%), Filipino (11.1%, a difference of 3.4%), Thai (11.6%, a difference of 7.4%), Chinese (11.9%, a difference of 10.7%), and Immigrants from Hong Kong (12.1%, a difference of 12.7%).
| Demographics | Rating | Rank | Child Poverty Under the Age of 16 |
| Immigrants | India | 100.0 /100 | #1 | Exceptional 10.8% |
| Immigrants | Taiwan | 100.0 /100 | #2 | Exceptional 11.0% |
| Filipinos | 100.0 /100 | #3 | Exceptional 11.1% |
| Thais | 100.0 /100 | #4 | Exceptional 11.6% |
| Chinese | 100.0 /100 | #5 | Exceptional 11.9% |
| Immigrants | Hong Kong | 100.0 /100 | #6 | Exceptional 12.1% |
| Iranians | 100.0 /100 | #7 | Exceptional 12.2% |
| Immigrants | Singapore | 100.0 /100 | #8 | Exceptional 12.4% |
| Immigrants | Iran | 100.0 /100 | #9 | Exceptional 12.4% |
| Immigrants | South Central Asia | 99.9 /100 | #10 | Exceptional 12.5% |
| Bhutanese | 99.9 /100 | #11 | Exceptional 12.5% |
| Immigrants | Ireland | 99.9 /100 | #12 | Exceptional 12.7% |
| Burmese | 99.9 /100 | #13 | Exceptional 12.8% |
| Immigrants | Lithuania | 99.9 /100 | #14 | Exceptional 12.9% |
| Immigrants | Korea | 99.9 /100 | #15 | Exceptional 13.0% |