Blackfeet vs Immigrants from Nicaragua Receiving Food Stamps
COMPARE
Blackfeet
Immigrants from Nicaragua
Receiving Food Stamps
Receiving Food Stamps Comparison
Blackfeet
Immigrants from Nicaragua
14.3%
RECEIVING FOOD STAMPS
0.2/ 100
METRIC RATING
265th/ 347
METRIC RANK
17.2%
RECEIVING FOOD STAMPS
0.0/ 100
METRIC RATING
320th/ 347
METRIC RANK
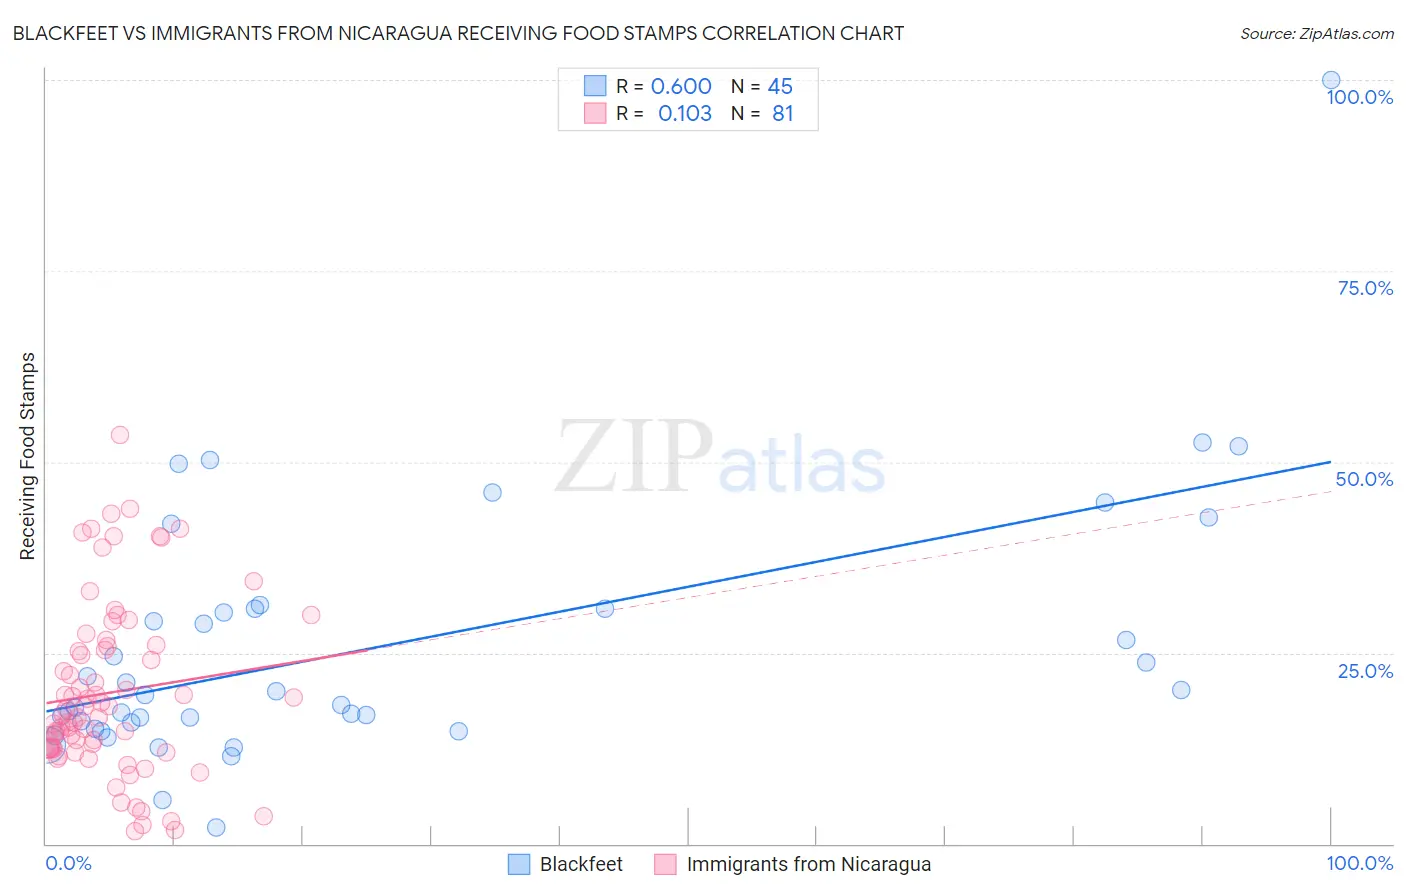
Blackfeet vs Immigrants from Nicaragua Receiving Food Stamps Correlation Chart
The statistical analysis conducted on geographies consisting of 309,276,068 people shows a significant positive correlation between the proportion of Blackfeet and percentage of population receiving government assistance and/or food stamps in the United States with a correlation coefficient (R) of 0.600 and weighted average of 14.3%. Similarly, the statistical analysis conducted on geographies consisting of 236,159,381 people shows a poor positive correlation between the proportion of Immigrants from Nicaragua and percentage of population receiving government assistance and/or food stamps in the United States with a correlation coefficient (R) of 0.103 and weighted average of 17.2%, a difference of 20.7%.
Receiving Food Stamps Correlation Summary
| Measurement | Blackfeet | Immigrants from Nicaragua |
| Minimum | 2.2% | 1.7% |
| Maximum | 100.0% | 53.6% |
| Range | 97.8% | 51.9% |
| Mean | 25.7% | 19.8% |
| Median | 19.5% | 17.0% |
| Interquartile 25% (IQ1) | 15.5% | 12.4% |
| Interquartile 75% (IQ3) | 30.8% | 25.9% |
| Interquartile Range (IQR) | 15.3% | 13.5% |
| Standard Deviation (Sample) | 17.1% | 11.3% |
| Standard Deviation (Population) | 16.9% | 11.2% |
Similar Demographics by Receiving Food Stamps
Demographics Similar to Blackfeet by Receiving Food Stamps
In terms of receiving food stamps, the demographic groups most similar to Blackfeet are Immigrants from Uzbekistan (14.3%, a difference of 0.050%), Cheyenne (14.3%, a difference of 0.080%), Paiute (14.3%, a difference of 0.15%), Immigrants from Portugal (14.3%, a difference of 0.15%), and Dutch West Indian (14.3%, a difference of 0.30%).
| Demographics | Rating | Rank | Receiving Food Stamps |
| Immigrants | Ghana | 0.3 /100 | #258 | Tragic 14.1% |
| Creek | 0.3 /100 | #259 | Tragic 14.1% |
| Central Americans | 0.3 /100 | #260 | Tragic 14.1% |
| Immigrants | Congo | 0.3 /100 | #261 | Tragic 14.1% |
| Paiute | 0.2 /100 | #262 | Tragic 14.3% |
| Immigrants | Portugal | 0.2 /100 | #263 | Tragic 14.3% |
| Immigrants | Uzbekistan | 0.2 /100 | #264 | Tragic 14.3% |
| Blackfeet | 0.2 /100 | #265 | Tragic 14.3% |
| Cheyenne | 0.2 /100 | #266 | Tragic 14.3% |
| Dutch West Indians | 0.2 /100 | #267 | Tragic 14.3% |
| Guatemalans | 0.1 /100 | #268 | Tragic 14.4% |
| Nepalese | 0.1 /100 | #269 | Tragic 14.6% |
| Mexicans | 0.1 /100 | #270 | Tragic 14.6% |
| Immigrants | Guatemala | 0.1 /100 | #271 | Tragic 14.6% |
| Chippewa | 0.1 /100 | #272 | Tragic 14.7% |
Demographics Similar to Immigrants from Nicaragua by Receiving Food Stamps
In terms of receiving food stamps, the demographic groups most similar to Immigrants from Nicaragua are Immigrants from St. Vincent and the Grenadines (17.2%, a difference of 0.080%), Native/Alaskan (17.3%, a difference of 0.18%), Menominee (17.2%, a difference of 0.26%), Black/African American (17.2%, a difference of 0.43%), and Central American Indian (17.1%, a difference of 0.96%).
| Demographics | Rating | Rank | Receiving Food Stamps |
| Immigrants | Jamaica | 0.0 /100 | #313 | Tragic 16.9% |
| Immigrants | Guyana | 0.0 /100 | #314 | Tragic 16.9% |
| Bahamians | 0.0 /100 | #315 | Tragic 17.0% |
| Central American Indians | 0.0 /100 | #316 | Tragic 17.1% |
| Blacks/African Americans | 0.0 /100 | #317 | Tragic 17.2% |
| Menominee | 0.0 /100 | #318 | Tragic 17.2% |
| Immigrants | St. Vincent and the Grenadines | 0.0 /100 | #319 | Tragic 17.2% |
| Immigrants | Nicaragua | 0.0 /100 | #320 | Tragic 17.2% |
| Natives/Alaskans | 0.0 /100 | #321 | Tragic 17.3% |
| Immigrants | Grenada | 0.0 /100 | #322 | Tragic 17.8% |
| Haitians | 0.0 /100 | #323 | Tragic 17.8% |
| British West Indians | 0.0 /100 | #324 | Tragic 17.9% |
| Immigrants | Haiti | 0.0 /100 | #325 | Tragic 18.2% |
| Cubans | 0.0 /100 | #326 | Tragic 18.2% |
| Apache | 0.0 /100 | #327 | Tragic 18.3% |