Bermudan vs Immigrants from Zimbabwe Child Poverty Under the Age of 5
COMPARE
Bermudan
Immigrants from Zimbabwe
Child Poverty Under the Age of 5
Child Poverty Under the Age of 5 Comparison
Bermudans
Immigrants from Zimbabwe
19.2%
CHILD POVERTY UNDER THE AGE OF 5
1.2/ 100
METRIC RATING
231st/ 347
METRIC RANK
15.8%
CHILD POVERTY UNDER THE AGE OF 5
95.9/ 100
METRIC RATING
101st/ 347
METRIC RANK
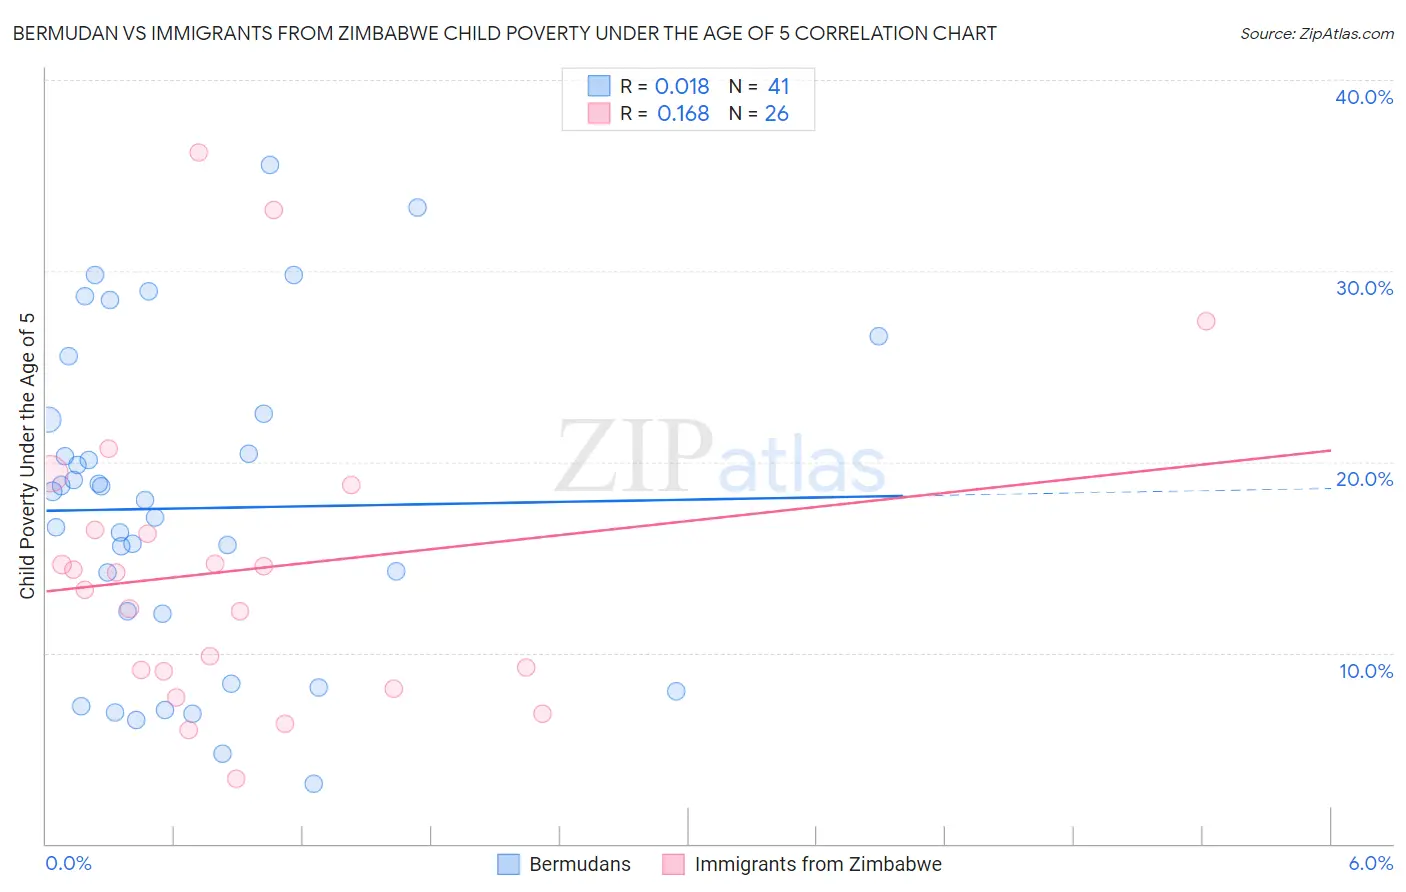
Bermudan vs Immigrants from Zimbabwe Child Poverty Under the Age of 5 Correlation Chart
The statistical analysis conducted on geographies consisting of 55,495,700 people shows no correlation between the proportion of Bermudans and poverty level among children under the age of 5 in the United States with a correlation coefficient (R) of 0.018 and weighted average of 19.2%. Similarly, the statistical analysis conducted on geographies consisting of 116,092,929 people shows a poor positive correlation between the proportion of Immigrants from Zimbabwe and poverty level among children under the age of 5 in the United States with a correlation coefficient (R) of 0.168 and weighted average of 15.8%, a difference of 21.4%.
Child Poverty Under the Age of 5 Correlation Summary
| Measurement | Bermudan | Immigrants from Zimbabwe |
| Minimum | 3.2% | 3.4% |
| Maximum | 35.5% | 36.2% |
| Range | 32.4% | 32.8% |
| Mean | 17.6% | 14.4% |
| Median | 18.0% | 13.8% |
| Interquartile 25% (IQ1) | 10.2% | 9.1% |
| Interquartile 75% (IQ3) | 22.4% | 16.4% |
| Interquartile Range (IQR) | 12.2% | 7.4% |
| Standard Deviation (Sample) | 8.3% | 8.0% |
| Standard Deviation (Population) | 8.2% | 7.9% |
Similar Demographics by Child Poverty Under the Age of 5
Demographics Similar to Bermudans by Child Poverty Under the Age of 5
In terms of child poverty under the age of 5, the demographic groups most similar to Bermudans are Ecuadorian (19.2%, a difference of 0.050%), Ghanaian (19.2%, a difference of 0.090%), Immigrants from Sudan (19.2%, a difference of 0.17%), Cape Verdean (19.1%, a difference of 0.48%), and Trinidadian and Tobagonian (19.3%, a difference of 0.56%).
| Demographics | Rating | Rank | Child Poverty Under the Age of 5 |
| Nicaraguans | 1.6 /100 | #224 | Tragic 19.1% |
| Nigerians | 1.6 /100 | #225 | Tragic 19.1% |
| Immigrants | Eritrea | 1.5 /100 | #226 | Tragic 19.1% |
| Cape Verdeans | 1.4 /100 | #227 | Tragic 19.1% |
| Immigrants | Sudan | 1.3 /100 | #228 | Tragic 19.2% |
| Ghanaians | 1.2 /100 | #229 | Tragic 19.2% |
| Ecuadorians | 1.2 /100 | #230 | Tragic 19.2% |
| Bermudans | 1.2 /100 | #231 | Tragic 19.2% |
| Trinidadians and Tobagonians | 0.9 /100 | #232 | Tragic 19.3% |
| Sudanese | 0.9 /100 | #233 | Tragic 19.3% |
| Immigrants | Micronesia | 0.9 /100 | #234 | Tragic 19.4% |
| Immigrants | Laos | 0.8 /100 | #235 | Tragic 19.4% |
| Immigrants | Trinidad and Tobago | 0.8 /100 | #236 | Tragic 19.4% |
| Immigrants | Cabo Verde | 0.6 /100 | #237 | Tragic 19.5% |
| Salvadorans | 0.6 /100 | #238 | Tragic 19.5% |
Demographics Similar to Immigrants from Zimbabwe by Child Poverty Under the Age of 5
In terms of child poverty under the age of 5, the demographic groups most similar to Immigrants from Zimbabwe are Immigrants from Canada (15.8%, a difference of 0.010%), Palestinian (15.8%, a difference of 0.020%), Immigrants from South Africa (15.8%, a difference of 0.13%), Armenian (15.8%, a difference of 0.13%), and Macedonian (15.8%, a difference of 0.20%).
| Demographics | Rating | Rank | Child Poverty Under the Age of 5 |
| Immigrants | South Eastern Asia | 97.1 /100 | #94 | Exceptional 15.7% |
| Immigrants | Switzerland | 96.4 /100 | #95 | Exceptional 15.8% |
| Immigrants | Kazakhstan | 96.2 /100 | #96 | Exceptional 15.8% |
| Macedonians | 96.2 /100 | #97 | Exceptional 15.8% |
| Immigrants | South Africa | 96.1 /100 | #98 | Exceptional 15.8% |
| Palestinians | 95.9 /100 | #99 | Exceptional 15.8% |
| Immigrants | Canada | 95.9 /100 | #100 | Exceptional 15.8% |
| Immigrants | Zimbabwe | 95.9 /100 | #101 | Exceptional 15.8% |
| Armenians | 95.7 /100 | #102 | Exceptional 15.8% |
| Europeans | 95.3 /100 | #103 | Exceptional 15.9% |
| Immigrants | North America | 94.9 /100 | #104 | Exceptional 15.9% |
| Immigrants | Spain | 94.8 /100 | #105 | Exceptional 15.9% |
| Tlingit-Haida | 94.7 /100 | #106 | Exceptional 15.9% |
| Slovenes | 94.4 /100 | #107 | Exceptional 16.0% |
| Immigrants | Brazil | 94.4 /100 | #108 | Exceptional 16.0% |