Bermudan vs Okinawan Receiving Food Stamps
COMPARE
Bermudan
Okinawan
Receiving Food Stamps
Receiving Food Stamps Comparison
Bermudans
Okinawans
13.0%
RECEIVING FOOD STAMPS
4.8/ 100
METRIC RATING
221st/ 347
METRIC RANK
8.9%
RECEIVING FOOD STAMPS
99.9/ 100
METRIC RATING
11th/ 347
METRIC RANK
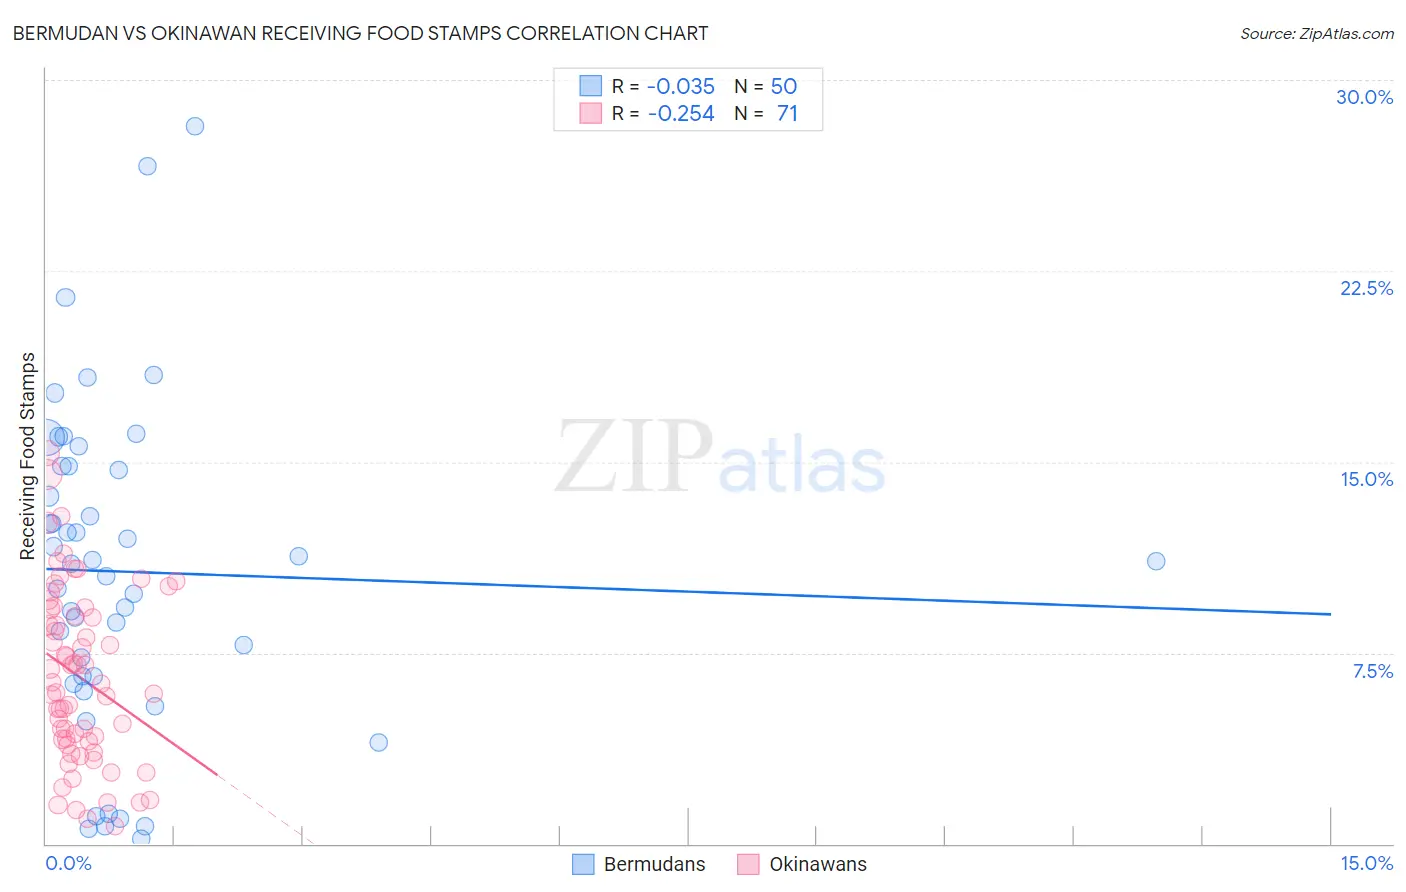
Bermudan vs Okinawan Receiving Food Stamps Correlation Chart
The statistical analysis conducted on geographies consisting of 55,651,694 people shows no correlation between the proportion of Bermudans and percentage of population receiving government assistance and/or food stamps in the United States with a correlation coefficient (R) of -0.035 and weighted average of 13.0%. Similarly, the statistical analysis conducted on geographies consisting of 73,571,871 people shows a weak negative correlation between the proportion of Okinawans and percentage of population receiving government assistance and/or food stamps in the United States with a correlation coefficient (R) of -0.254 and weighted average of 8.9%, a difference of 46.2%.
Receiving Food Stamps Correlation Summary
| Measurement | Bermudan | Okinawan |
| Minimum | 0.20% | 0.70% |
| Maximum | 28.2% | 15.3% |
| Range | 28.0% | 14.6% |
| Mean | 10.7% | 6.5% |
| Median | 11.1% | 6.3% |
| Interquartile 25% (IQ1) | 6.6% | 4.0% |
| Interquartile 75% (IQ3) | 14.8% | 9.2% |
| Interquartile Range (IQR) | 8.2% | 5.2% |
| Standard Deviation (Sample) | 6.3% | 3.4% |
| Standard Deviation (Population) | 6.3% | 3.4% |
Similar Demographics by Receiving Food Stamps
Demographics Similar to Bermudans by Receiving Food Stamps
In terms of receiving food stamps, the demographic groups most similar to Bermudans are Immigrants (13.0%, a difference of 0.26%), Immigrants from Albania (13.0%, a difference of 0.30%), Immigrants from Colombia (12.9%, a difference of 0.32%), Immigrants from Middle Africa (12.9%, a difference of 0.36%), and Hawaiian (12.9%, a difference of 0.37%).
| Demographics | Rating | Rank | Receiving Food Stamps |
| Immigrants | Africa | 7.6 /100 | #214 | Tragic 12.8% |
| Native Hawaiians | 6.7 /100 | #215 | Tragic 12.8% |
| Immigrants | South America | 6.5 /100 | #216 | Tragic 12.8% |
| Immigrants | Burma/Myanmar | 6.0 /100 | #217 | Tragic 12.9% |
| Hawaiians | 5.4 /100 | #218 | Tragic 12.9% |
| Immigrants | Middle Africa | 5.4 /100 | #219 | Tragic 12.9% |
| Immigrants | Colombia | 5.3 /100 | #220 | Tragic 12.9% |
| Bermudans | 4.8 /100 | #221 | Tragic 13.0% |
| Immigrants | Immigrants | 4.4 /100 | #222 | Tragic 13.0% |
| Immigrants | Albania | 4.4 /100 | #223 | Tragic 13.0% |
| Immigrants | Armenia | 4.3 /100 | #224 | Tragic 13.0% |
| Fijians | 4.3 /100 | #225 | Tragic 13.0% |
| Chickasaw | 3.6 /100 | #226 | Tragic 13.1% |
| Nigerians | 3.5 /100 | #227 | Tragic 13.1% |
| Panamanians | 3.5 /100 | #228 | Tragic 13.1% |
Demographics Similar to Okinawans by Receiving Food Stamps
In terms of receiving food stamps, the demographic groups most similar to Okinawans are Cypriot (8.9%, a difference of 0.010%), Bulgarian (8.9%, a difference of 0.20%), Maltese (8.9%, a difference of 0.33%), Immigrants from South Central Asia (8.8%, a difference of 0.43%), and Norwegian (9.0%, a difference of 0.99%).
| Demographics | Rating | Rank | Receiving Food Stamps |
| Iranians | 100.0 /100 | #4 | Exceptional 7.9% |
| Thais | 100.0 /100 | #5 | Exceptional 8.1% |
| Immigrants | Singapore | 100.0 /100 | #6 | Exceptional 8.3% |
| Immigrants | Iran | 100.0 /100 | #7 | Exceptional 8.3% |
| Burmese | 99.9 /100 | #8 | Exceptional 8.6% |
| Immigrants | Korea | 99.9 /100 | #9 | Exceptional 8.7% |
| Immigrants | South Central Asia | 99.9 /100 | #10 | Exceptional 8.8% |
| Okinawans | 99.9 /100 | #11 | Exceptional 8.9% |
| Cypriots | 99.9 /100 | #12 | Exceptional 8.9% |
| Bulgarians | 99.9 /100 | #13 | Exceptional 8.9% |
| Maltese | 99.9 /100 | #14 | Exceptional 8.9% |
| Norwegians | 99.9 /100 | #15 | Exceptional 9.0% |
| Immigrants | Japan | 99.9 /100 | #16 | Exceptional 9.0% |
| Immigrants | Scotland | 99.9 /100 | #17 | Exceptional 9.0% |
| Danes | 99.9 /100 | #18 | Exceptional 9.0% |