Immigrants from Honduras vs Salvadoran Receiving Food Stamps
COMPARE
Immigrants from Honduras
Salvadoran
Receiving Food Stamps
Receiving Food Stamps Comparison
Immigrants from Honduras
Salvadorans
15.7%
RECEIVING FOOD STAMPS
0.0/ 100
METRIC RATING
295th/ 347
METRIC RANK
13.2%
RECEIVING FOOD STAMPS
2.7/ 100
METRIC RATING
232nd/ 347
METRIC RANK
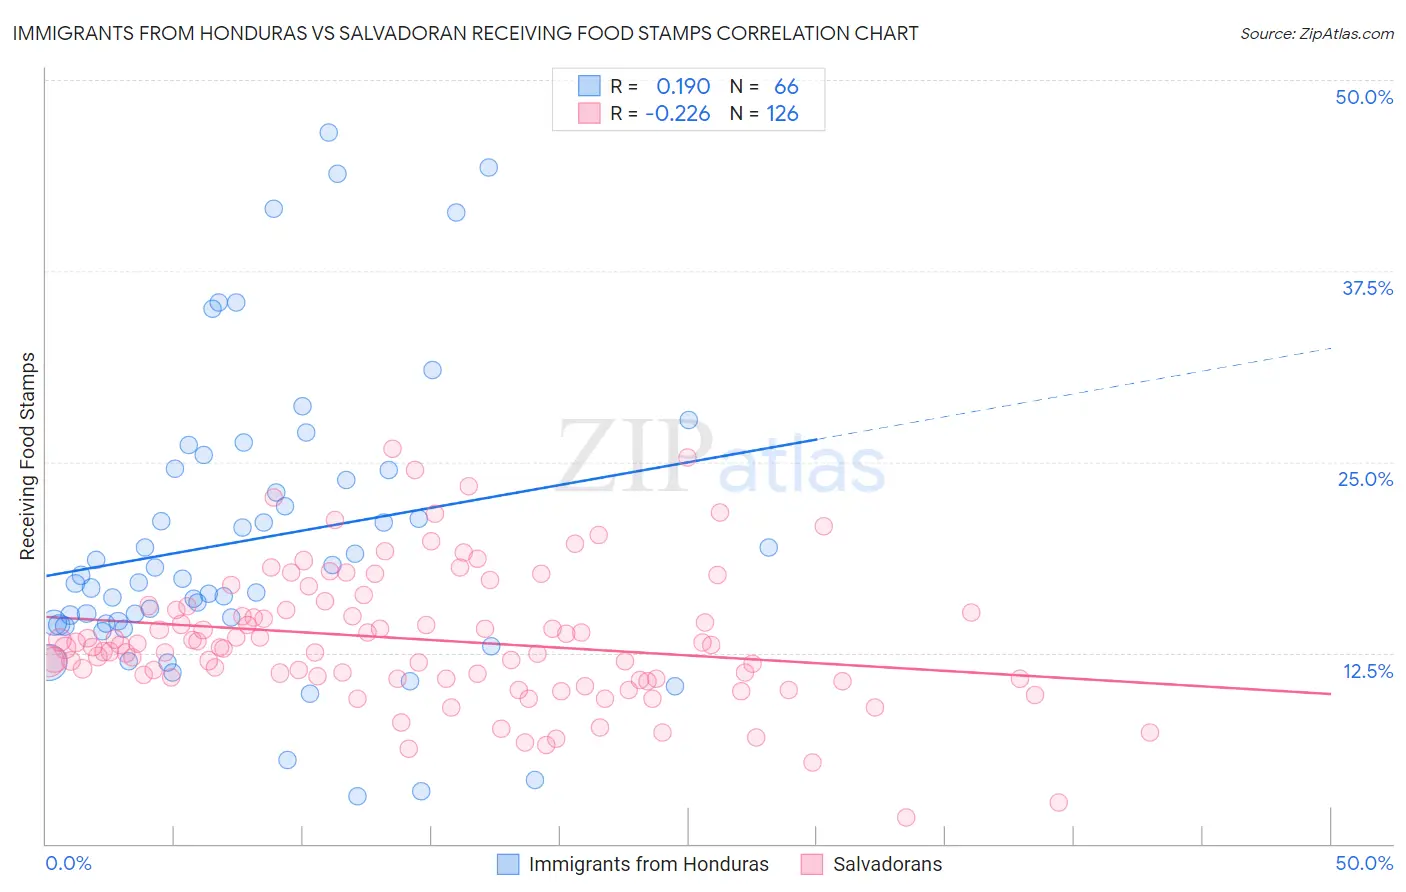
Immigrants from Honduras vs Salvadoran Receiving Food Stamps Correlation Chart
The statistical analysis conducted on geographies consisting of 322,297,713 people shows a poor positive correlation between the proportion of Immigrants from Honduras and percentage of population receiving government assistance and/or food stamps in the United States with a correlation coefficient (R) of 0.190 and weighted average of 15.7%. Similarly, the statistical analysis conducted on geographies consisting of 398,082,063 people shows a weak negative correlation between the proportion of Salvadorans and percentage of population receiving government assistance and/or food stamps in the United States with a correlation coefficient (R) of -0.226 and weighted average of 13.2%, a difference of 19.1%.
Receiving Food Stamps Correlation Summary
| Measurement | Immigrants from Honduras | Salvadoran |
| Minimum | 3.1% | 1.7% |
| Maximum | 46.6% | 25.9% |
| Range | 43.5% | 24.2% |
| Mean | 19.9% | 13.4% |
| Median | 17.2% | 12.9% |
| Interquartile 25% (IQ1) | 14.4% | 10.8% |
| Interquartile 75% (IQ3) | 24.5% | 15.3% |
| Interquartile Range (IQR) | 10.1% | 4.5% |
| Standard Deviation (Sample) | 9.7% | 4.4% |
| Standard Deviation (Population) | 9.6% | 4.3% |
Similar Demographics by Receiving Food Stamps
Demographics Similar to Immigrants from Honduras by Receiving Food Stamps
In terms of receiving food stamps, the demographic groups most similar to Immigrants from Honduras are Tsimshian (15.7%, a difference of 0.010%), Immigrants from Bahamas (15.8%, a difference of 0.17%), Immigrants from Latin America (15.7%, a difference of 0.32%), Immigrants from Trinidad and Tobago (15.8%, a difference of 0.42%), and Vietnamese (15.7%, a difference of 0.43%).
| Demographics | Rating | Rank | Receiving Food Stamps |
| Immigrants | Belize | 0.0 /100 | #288 | Tragic 15.2% |
| Immigrants | Senegal | 0.0 /100 | #289 | Tragic 15.3% |
| Senegalese | 0.0 /100 | #290 | Tragic 15.4% |
| Hondurans | 0.0 /100 | #291 | Tragic 15.5% |
| Alaska Natives | 0.0 /100 | #292 | Tragic 15.6% |
| Vietnamese | 0.0 /100 | #293 | Tragic 15.7% |
| Immigrants | Latin America | 0.0 /100 | #294 | Tragic 15.7% |
| Immigrants | Honduras | 0.0 /100 | #295 | Tragic 15.7% |
| Tsimshian | 0.0 /100 | #296 | Tragic 15.7% |
| Immigrants | Bahamas | 0.0 /100 | #297 | Tragic 15.8% |
| Immigrants | Trinidad and Tobago | 0.0 /100 | #298 | Tragic 15.8% |
| Hispanics or Latinos | 0.0 /100 | #299 | Tragic 15.8% |
| Immigrants | Bangladesh | 0.0 /100 | #300 | Tragic 15.9% |
| Trinidadians and Tobagonians | 0.0 /100 | #301 | Tragic 16.0% |
| Immigrants | West Indies | 0.0 /100 | #302 | Tragic 16.1% |
Demographics Similar to Salvadorans by Receiving Food Stamps
In terms of receiving food stamps, the demographic groups most similar to Salvadorans are Cherokee (13.2%, a difference of 0.26%), Comanche (13.3%, a difference of 0.38%), Immigrants from Nigeria (13.1%, a difference of 0.73%), Puget Sound Salish (13.1%, a difference of 0.77%), and Ottawa (13.1%, a difference of 0.82%).
| Demographics | Rating | Rank | Receiving Food Stamps |
| Fijians | 4.3 /100 | #225 | Tragic 13.0% |
| Chickasaw | 3.6 /100 | #226 | Tragic 13.1% |
| Nigerians | 3.5 /100 | #227 | Tragic 13.1% |
| Panamanians | 3.5 /100 | #228 | Tragic 13.1% |
| Ottawa | 3.5 /100 | #229 | Tragic 13.1% |
| Puget Sound Salish | 3.4 /100 | #230 | Tragic 13.1% |
| Immigrants | Nigeria | 3.4 /100 | #231 | Tragic 13.1% |
| Salvadorans | 2.7 /100 | #232 | Tragic 13.2% |
| Cherokee | 2.5 /100 | #233 | Tragic 13.2% |
| Comanche | 2.4 /100 | #234 | Tragic 13.3% |
| Immigrants | Zaire | 1.9 /100 | #235 | Tragic 13.4% |
| Crow | 1.6 /100 | #236 | Tragic 13.4% |
| Immigrants | El Salvador | 1.5 /100 | #237 | Tragic 13.5% |
| French American Indians | 1.4 /100 | #238 | Tragic 13.5% |
| Immigrants | Micronesia | 1.3 /100 | #239 | Tragic 13.5% |