Bangladeshi vs Afghan Single Father Poverty
COMPARE
Bangladeshi
Afghan
Single Father Poverty
Single Father Poverty Comparison
Bangladeshis
Afghans
15.2%
SINGLE FATHER POVERTY
99.8/ 100
METRIC RATING
64th/ 347
METRIC RANK
14.0%
SINGLE FATHER POVERTY
100.0/ 100
METRIC RATING
9th/ 347
METRIC RANK
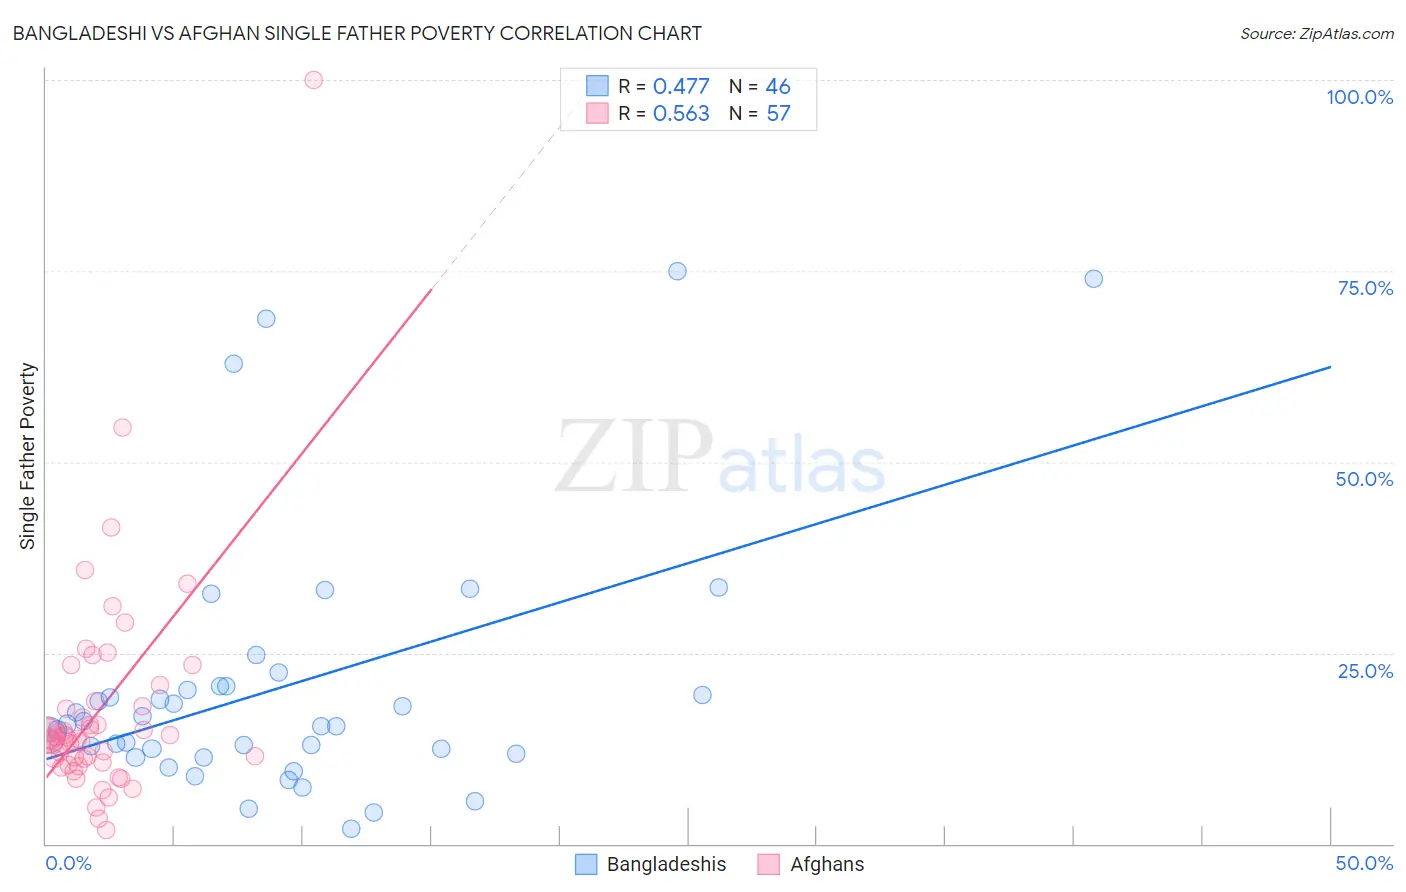
Bangladeshi vs Afghan Single Father Poverty Correlation Chart
The statistical analysis conducted on geographies consisting of 125,568,753 people shows a moderate positive correlation between the proportion of Bangladeshis and poverty level among single fathers in the United States with a correlation coefficient (R) of 0.477 and weighted average of 15.2%. Similarly, the statistical analysis conducted on geographies consisting of 131,158,904 people shows a substantial positive correlation between the proportion of Afghans and poverty level among single fathers in the United States with a correlation coefficient (R) of 0.563 and weighted average of 14.0%, a difference of 8.8%.
Single Father Poverty Correlation Summary
| Measurement | Bangladeshi | Afghan |
| Minimum | 2.0% | 1.7% |
| Maximum | 75.0% | 100.0% |
| Range | 73.0% | 98.3% |
| Mean | 20.5% | 17.5% |
| Median | 15.5% | 13.9% |
| Interquartile 25% (IQ1) | 11.7% | 10.8% |
| Interquartile 75% (IQ3) | 20.6% | 18.3% |
| Interquartile Range (IQR) | 8.8% | 7.5% |
| Standard Deviation (Sample) | 17.2% | 14.6% |
| Standard Deviation (Population) | 17.0% | 14.4% |
Similar Demographics by Single Father Poverty
Demographics Similar to Bangladeshis by Single Father Poverty
In terms of single father poverty, the demographic groups most similar to Bangladeshis are Immigrants from Sweden (15.2%, a difference of 0.080%), Immigrants from Malaysia (15.2%, a difference of 0.090%), Immigrants from Moldova (15.2%, a difference of 0.11%), Immigrants from Armenia (15.2%, a difference of 0.17%), and Immigrants from Bosnia and Herzegovina (15.2%, a difference of 0.18%).
| Demographics | Rating | Rank | Single Father Poverty |
| Laotians | 99.9 /100 | #57 | Exceptional 15.1% |
| Hawaiians | 99.9 /100 | #58 | Exceptional 15.1% |
| Guamanians/Chamorros | 99.9 /100 | #59 | Exceptional 15.1% |
| Puget Sound Salish | 99.8 /100 | #60 | Exceptional 15.2% |
| Immigrants | Bosnia and Herzegovina | 99.8 /100 | #61 | Exceptional 15.2% |
| Immigrants | Armenia | 99.8 /100 | #62 | Exceptional 15.2% |
| Immigrants | Sweden | 99.8 /100 | #63 | Exceptional 15.2% |
| Bangladeshis | 99.8 /100 | #64 | Exceptional 15.2% |
| Immigrants | Malaysia | 99.8 /100 | #65 | Exceptional 15.2% |
| Immigrants | Moldova | 99.8 /100 | #66 | Exceptional 15.2% |
| Paraguayans | 99.7 /100 | #67 | Exceptional 15.2% |
| Immigrants | Cameroon | 99.7 /100 | #68 | Exceptional 15.2% |
| Japanese | 99.7 /100 | #69 | Exceptional 15.2% |
| Mongolians | 99.7 /100 | #70 | Exceptional 15.3% |
| Immigrants | Brazil | 99.6 /100 | #71 | Exceptional 15.3% |
Demographics Similar to Afghans by Single Father Poverty
In terms of single father poverty, the demographic groups most similar to Afghans are Korean (14.0%, a difference of 0.10%), Filipino (14.0%, a difference of 0.51%), Immigrants from India (14.0%, a difference of 0.51%), Immigrants from Philippines (14.0%, a difference of 0.66%), and Samoan (13.8%, a difference of 1.1%).
| Demographics | Rating | Rank | Single Father Poverty |
| Tongans | 100.0 /100 | #2 | Exceptional 12.2% |
| Tsimshian | 100.0 /100 | #3 | Exceptional 12.7% |
| Immigrants | Fiji | 100.0 /100 | #4 | Exceptional 13.2% |
| Immigrants | Ethiopia | 100.0 /100 | #5 | Exceptional 13.4% |
| Ethiopians | 100.0 /100 | #6 | Exceptional 13.5% |
| Immigrants | Taiwan | 100.0 /100 | #7 | Exceptional 13.7% |
| Samoans | 100.0 /100 | #8 | Exceptional 13.8% |
| Afghans | 100.0 /100 | #9 | Exceptional 14.0% |
| Koreans | 100.0 /100 | #10 | Exceptional 14.0% |
| Filipinos | 100.0 /100 | #11 | Exceptional 14.0% |
| Immigrants | India | 100.0 /100 | #12 | Exceptional 14.0% |
| Immigrants | Philippines | 100.0 /100 | #13 | Exceptional 14.0% |
| Immigrants | Vietnam | 100.0 /100 | #14 | Exceptional 14.1% |
| Sri Lankans | 100.0 /100 | #15 | Exceptional 14.2% |
| Immigrants | Iran | 100.0 /100 | #16 | Exceptional 14.2% |