Bangladeshi vs Mexican Single Mother Poverty
COMPARE
Bangladeshi
Mexican
Single Mother Poverty
Single Mother Poverty Comparison
Bangladeshis
Mexicans
31.7%
SINGLE MOTHER POVERTY
0.1/ 100
METRIC RATING
274th/ 347
METRIC RANK
33.6%
SINGLE MOTHER POVERTY
0.0/ 100
METRIC RATING
304th/ 347
METRIC RANK
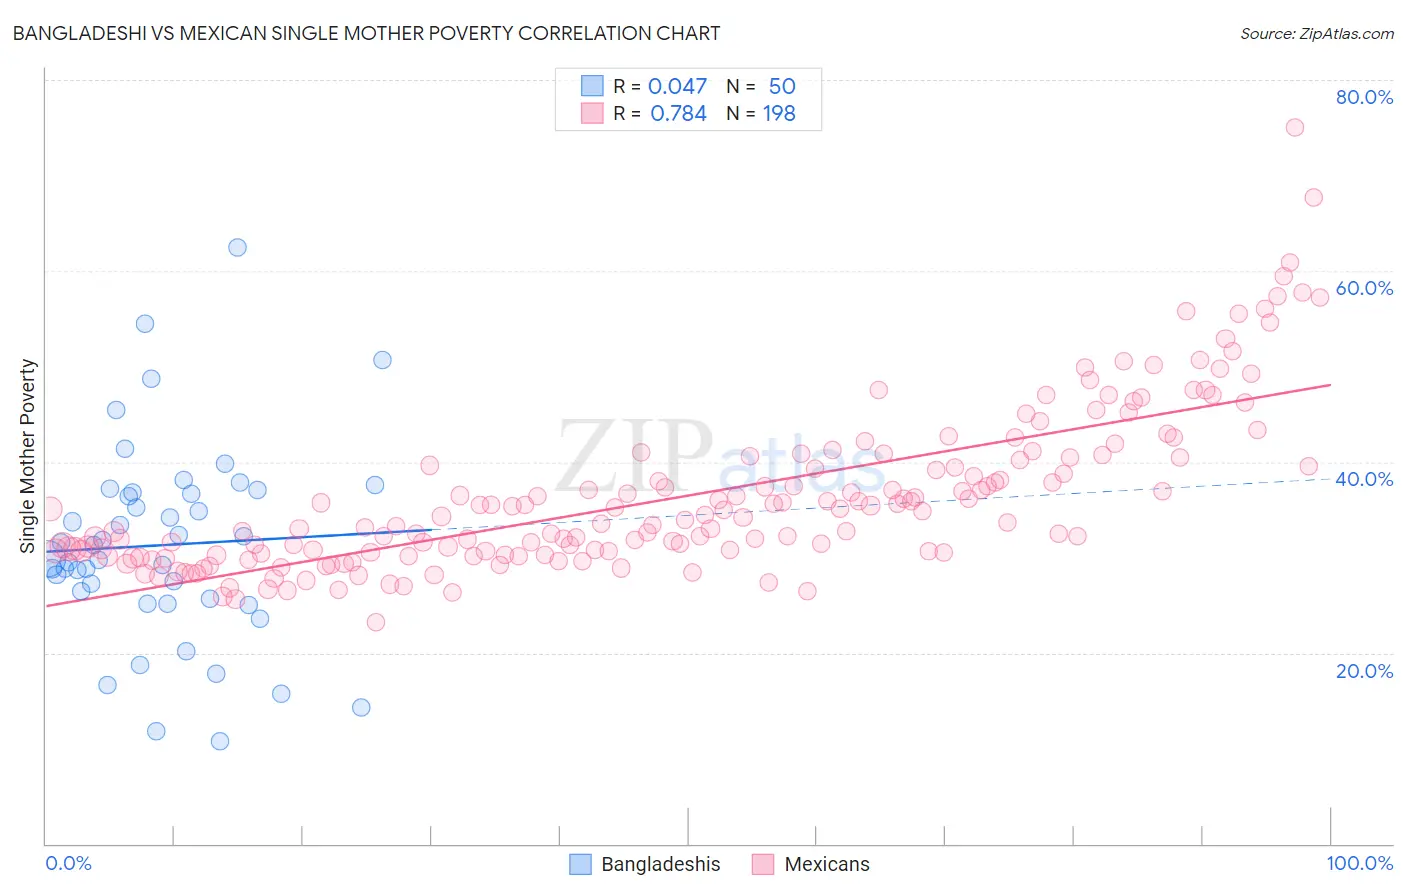
Bangladeshi vs Mexican Single Mother Poverty Correlation Chart
The statistical analysis conducted on geographies consisting of 140,162,817 people shows no correlation between the proportion of Bangladeshis and poverty level among single mothers in the United States with a correlation coefficient (R) of 0.047 and weighted average of 31.7%. Similarly, the statistical analysis conducted on geographies consisting of 540,682,804 people shows a strong positive correlation between the proportion of Mexicans and poverty level among single mothers in the United States with a correlation coefficient (R) of 0.784 and weighted average of 33.6%, a difference of 5.8%.
Single Mother Poverty Correlation Summary
| Measurement | Bangladeshi | Mexican |
| Minimum | 10.8% | 23.2% |
| Maximum | 62.5% | 75.0% |
| Range | 51.7% | 51.8% |
| Mean | 31.3% | 36.4% |
| Median | 30.5% | 34.1% |
| Interquartile 25% (IQ1) | 25.7% | 30.5% |
| Interquartile 75% (IQ3) | 36.8% | 40.2% |
| Interquartile Range (IQR) | 11.1% | 9.7% |
| Standard Deviation (Sample) | 10.3% | 8.5% |
| Standard Deviation (Population) | 10.2% | 8.5% |
Similar Demographics by Single Mother Poverty
Demographics Similar to Bangladeshis by Single Mother Poverty
In terms of single mother poverty, the demographic groups most similar to Bangladeshis are Central American (31.8%, a difference of 0.19%), Fijian (31.6%, a difference of 0.23%), Delaware (31.8%, a difference of 0.35%), Immigrants from Micronesia (31.6%, a difference of 0.46%), and Immigrants from Cabo Verde (31.6%, a difference of 0.48%).
| Demographics | Rating | Rank | Single Mother Poverty |
| Immigrants | Belize | 0.2 /100 | #267 | Tragic 31.4% |
| Immigrants | Senegal | 0.1 /100 | #268 | Tragic 31.5% |
| Scotch-Irish | 0.1 /100 | #269 | Tragic 31.5% |
| British West Indians | 0.1 /100 | #270 | Tragic 31.5% |
| Immigrants | Cabo Verde | 0.1 /100 | #271 | Tragic 31.6% |
| Immigrants | Micronesia | 0.1 /100 | #272 | Tragic 31.6% |
| Fijians | 0.1 /100 | #273 | Tragic 31.6% |
| Bangladeshis | 0.1 /100 | #274 | Tragic 31.7% |
| Central Americans | 0.1 /100 | #275 | Tragic 31.8% |
| Delaware | 0.0 /100 | #276 | Tragic 31.8% |
| Mexican American Indians | 0.0 /100 | #277 | Tragic 31.9% |
| Immigrants | Zaire | 0.0 /100 | #278 | Tragic 32.0% |
| Marshallese | 0.0 /100 | #279 | Tragic 32.1% |
| Immigrants | Nonimmigrants | 0.0 /100 | #280 | Tragic 32.2% |
| Cree | 0.0 /100 | #281 | Tragic 32.2% |
Demographics Similar to Mexicans by Single Mother Poverty
In terms of single mother poverty, the demographic groups most similar to Mexicans are Immigrants from Central America (33.6%, a difference of 0.040%), American (33.5%, a difference of 0.10%), Arapaho (33.4%, a difference of 0.37%), Immigrants from Somalia (33.4%, a difference of 0.51%), and Immigrants from Congo (33.8%, a difference of 0.68%).
| Demographics | Rating | Rank | Single Mother Poverty |
| Pennsylvania Germans | 0.0 /100 | #297 | Tragic 33.2% |
| Africans | 0.0 /100 | #298 | Tragic 33.3% |
| Immigrants | Guatemala | 0.0 /100 | #299 | Tragic 33.3% |
| Hispanics or Latinos | 0.0 /100 | #300 | Tragic 33.3% |
| Immigrants | Somalia | 0.0 /100 | #301 | Tragic 33.4% |
| Arapaho | 0.0 /100 | #302 | Tragic 33.4% |
| Americans | 0.0 /100 | #303 | Tragic 33.5% |
| Mexicans | 0.0 /100 | #304 | Tragic 33.6% |
| Immigrants | Central America | 0.0 /100 | #305 | Tragic 33.6% |
| Immigrants | Congo | 0.0 /100 | #306 | Tragic 33.8% |
| Comanche | 0.0 /100 | #307 | Tragic 33.9% |
| Immigrants | Mexico | 0.0 /100 | #308 | Tragic 34.0% |
| Potawatomi | 0.0 /100 | #309 | Tragic 34.1% |
| Hondurans | 0.0 /100 | #310 | Tragic 34.2% |
| Alsatians | 0.0 /100 | #311 | Tragic 34.3% |