Bahamian vs Brazilian Child Poverty Among Boys Under 16
COMPARE
Bahamian
Brazilian
Child Poverty Among Boys Under 16
Child Poverty Among Boys Under 16 Comparison
Bahamians
Brazilians
21.6%
CHILD POVERTY AMONG BOYS UNDER 16
0.0/ 100
METRIC RATING
311th/ 347
METRIC RANK
15.8%
CHILD POVERTY AMONG BOYS UNDER 16
81.0/ 100
METRIC RATING
148th/ 347
METRIC RANK
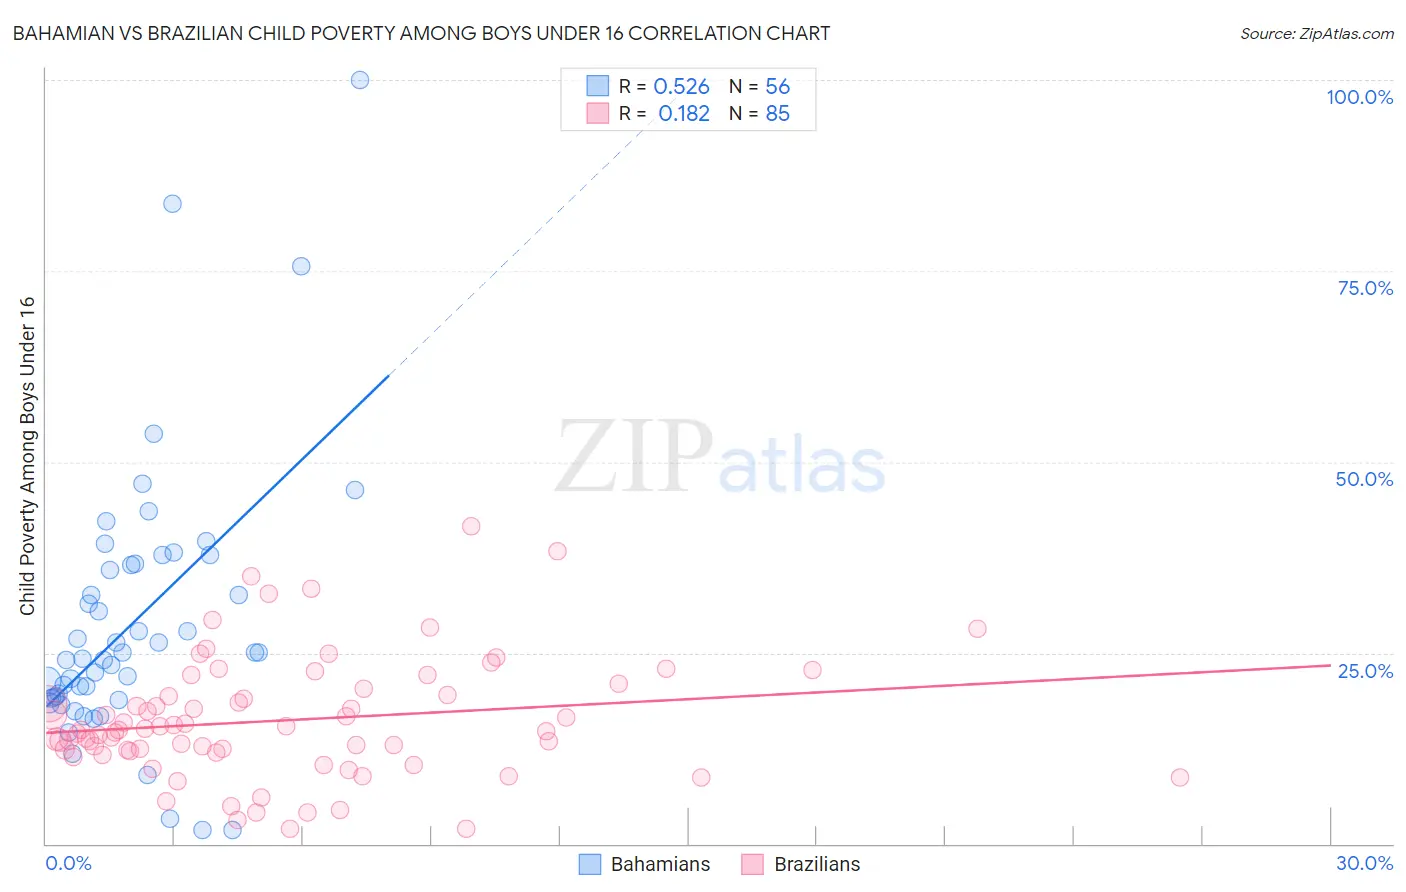
Bahamian vs Brazilian Child Poverty Among Boys Under 16 Correlation Chart
The statistical analysis conducted on geographies consisting of 112,074,604 people shows a substantial positive correlation between the proportion of Bahamians and poverty level among boys under the age of 16 in the United States with a correlation coefficient (R) of 0.526 and weighted average of 21.6%. Similarly, the statistical analysis conducted on geographies consisting of 319,230,692 people shows a poor positive correlation between the proportion of Brazilians and poverty level among boys under the age of 16 in the United States with a correlation coefficient (R) of 0.182 and weighted average of 15.8%, a difference of 36.7%.
Child Poverty Among Boys Under 16 Correlation Summary
| Measurement | Bahamian | Brazilian |
| Minimum | 1.7% | 1.9% |
| Maximum | 100.0% | 41.6% |
| Range | 98.3% | 39.6% |
| Mean | 28.9% | 16.2% |
| Median | 24.6% | 14.9% |
| Interquartile 25% (IQ1) | 19.1% | 12.1% |
| Interquartile 75% (IQ3) | 36.6% | 19.9% |
| Interquartile Range (IQR) | 17.4% | 7.8% |
| Standard Deviation (Sample) | 17.8% | 7.9% |
| Standard Deviation (Population) | 17.6% | 7.9% |
Similar Demographics by Child Poverty Among Boys Under 16
Demographics Similar to Bahamians by Child Poverty Among Boys Under 16
In terms of child poverty among boys under 16, the demographic groups most similar to Bahamians are Immigrants from Guatemala (21.6%, a difference of 0.080%), British West Indian (21.6%, a difference of 0.090%), Ute (21.6%, a difference of 0.10%), Creek (21.5%, a difference of 0.11%), and Seminole (21.5%, a difference of 0.17%).
| Demographics | Rating | Rank | Child Poverty Among Boys Under 16 |
| Immigrants | Central America | 0.0 /100 | #304 | Tragic 21.3% |
| Kiowa | 0.0 /100 | #305 | Tragic 21.3% |
| Immigrants | Grenada | 0.0 /100 | #306 | Tragic 21.3% |
| Choctaw | 0.0 /100 | #307 | Tragic 21.3% |
| Immigrants | Mexico | 0.0 /100 | #308 | Tragic 21.5% |
| Seminole | 0.0 /100 | #309 | Tragic 21.5% |
| Creek | 0.0 /100 | #310 | Tragic 21.5% |
| Bahamians | 0.0 /100 | #311 | Tragic 21.6% |
| Immigrants | Guatemala | 0.0 /100 | #312 | Tragic 21.6% |
| British West Indians | 0.0 /100 | #313 | Tragic 21.6% |
| Ute | 0.0 /100 | #314 | Tragic 21.6% |
| Immigrants | Somalia | 0.0 /100 | #315 | Tragic 21.7% |
| Menominee | 0.0 /100 | #316 | Tragic 21.7% |
| Africans | 0.0 /100 | #317 | Tragic 21.7% |
| Yakama | 0.0 /100 | #318 | Tragic 21.7% |
Demographics Similar to Brazilians by Child Poverty Among Boys Under 16
In terms of child poverty among boys under 16, the demographic groups most similar to Brazilians are Slovak (15.8%, a difference of 0.14%), Immigrants from Jordan (15.8%, a difference of 0.15%), Venezuelan (15.7%, a difference of 0.20%), Puget Sound Salish (15.8%, a difference of 0.23%), and New Zealander (15.7%, a difference of 0.27%).
| Demographics | Rating | Rank | Child Poverty Among Boys Under 16 |
| Slavs | 84.5 /100 | #141 | Excellent 15.7% |
| Immigrants | Hungary | 84.1 /100 | #142 | Excellent 15.7% |
| Immigrants | Fiji | 83.6 /100 | #143 | Excellent 15.7% |
| Immigrants | Peru | 83.5 /100 | #144 | Excellent 15.7% |
| Samoans | 83.2 /100 | #145 | Excellent 15.7% |
| New Zealanders | 82.4 /100 | #146 | Excellent 15.7% |
| Venezuelans | 82.1 /100 | #147 | Excellent 15.7% |
| Brazilians | 81.0 /100 | #148 | Excellent 15.8% |
| Slovaks | 80.3 /100 | #149 | Excellent 15.8% |
| Immigrants | Jordan | 80.2 /100 | #150 | Excellent 15.8% |
| Puget Sound Salish | 79.8 /100 | #151 | Good 15.8% |
| Immigrants | Venezuela | 79.5 /100 | #152 | Good 15.8% |
| French | 78.7 /100 | #153 | Good 15.8% |
| Syrians | 77.5 /100 | #154 | Good 15.9% |
| French Canadians | 76.6 /100 | #155 | Good 15.9% |