Bahamian vs Immigrants from Africa Child Poverty Among Boys Under 16
COMPARE
Bahamian
Immigrants from Africa
Child Poverty Among Boys Under 16
Child Poverty Among Boys Under 16 Comparison
Bahamians
Immigrants from Africa
21.6%
CHILD POVERTY AMONG BOYS UNDER 16
0.0/ 100
METRIC RATING
311th/ 347
METRIC RANK
18.1%
CHILD POVERTY AMONG BOYS UNDER 16
2.6/ 100
METRIC RATING
226th/ 347
METRIC RANK
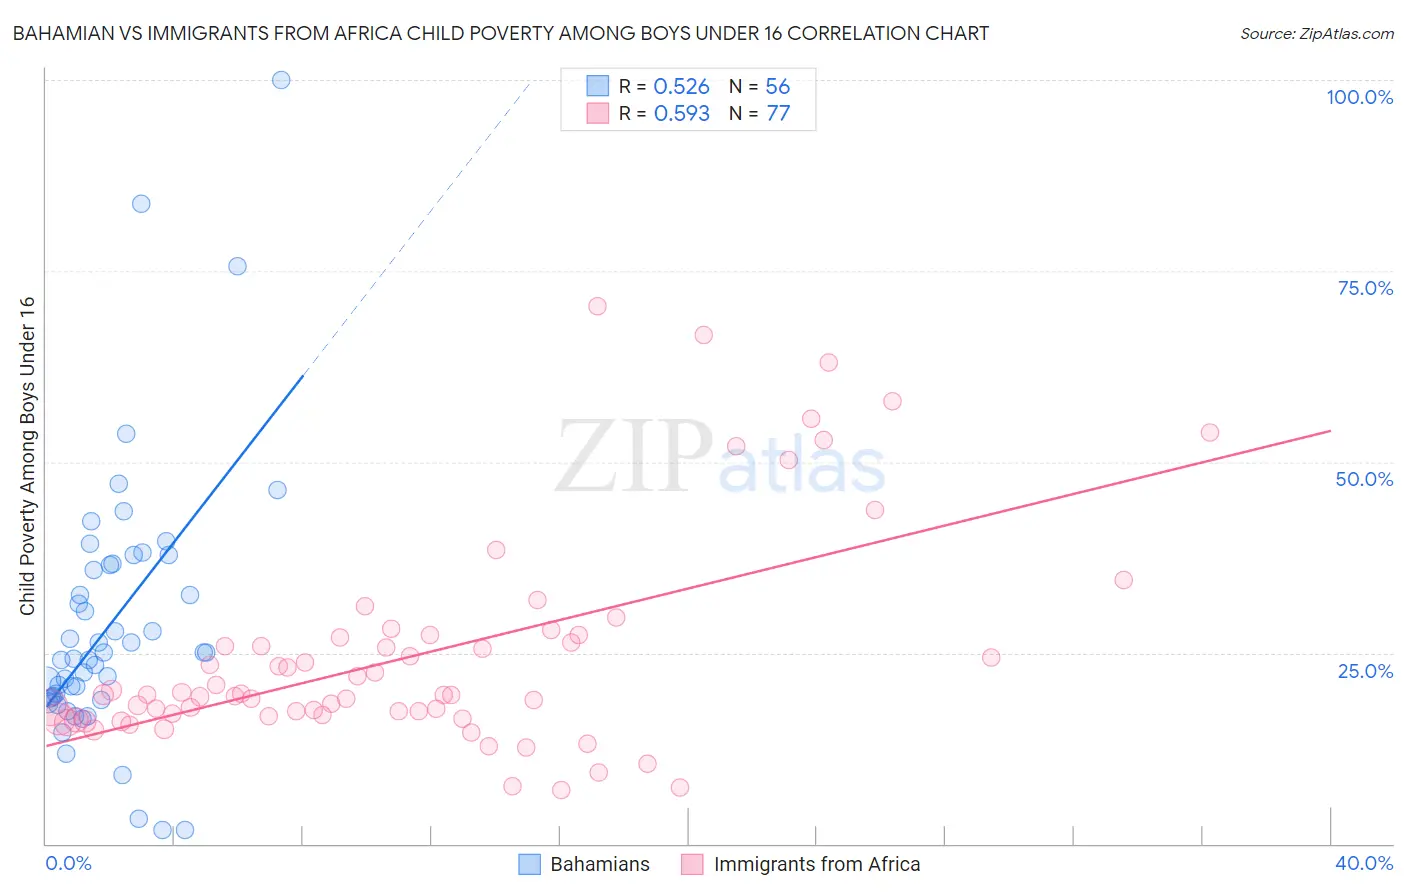
Bahamian vs Immigrants from Africa Child Poverty Among Boys Under 16 Correlation Chart
The statistical analysis conducted on geographies consisting of 112,074,604 people shows a substantial positive correlation between the proportion of Bahamians and poverty level among boys under the age of 16 in the United States with a correlation coefficient (R) of 0.526 and weighted average of 21.6%. Similarly, the statistical analysis conducted on geographies consisting of 459,821,531 people shows a substantial positive correlation between the proportion of Immigrants from Africa and poverty level among boys under the age of 16 in the United States with a correlation coefficient (R) of 0.593 and weighted average of 18.1%, a difference of 19.1%.
Child Poverty Among Boys Under 16 Correlation Summary
| Measurement | Bahamian | Immigrants from Africa |
| Minimum | 1.7% | 7.1% |
| Maximum | 100.0% | 70.3% |
| Range | 98.3% | 63.3% |
| Mean | 28.9% | 24.7% |
| Median | 24.6% | 19.5% |
| Interquartile 25% (IQ1) | 19.1% | 16.8% |
| Interquartile 75% (IQ3) | 36.6% | 27.1% |
| Interquartile Range (IQR) | 17.4% | 10.3% |
| Standard Deviation (Sample) | 17.8% | 14.0% |
| Standard Deviation (Population) | 17.6% | 13.9% |
Similar Demographics by Child Poverty Among Boys Under 16
Demographics Similar to Bahamians by Child Poverty Among Boys Under 16
In terms of child poverty among boys under 16, the demographic groups most similar to Bahamians are Immigrants from Guatemala (21.6%, a difference of 0.080%), British West Indian (21.6%, a difference of 0.090%), Ute (21.6%, a difference of 0.10%), Creek (21.5%, a difference of 0.11%), and Seminole (21.5%, a difference of 0.17%).
| Demographics | Rating | Rank | Child Poverty Among Boys Under 16 |
| Immigrants | Central America | 0.0 /100 | #304 | Tragic 21.3% |
| Kiowa | 0.0 /100 | #305 | Tragic 21.3% |
| Immigrants | Grenada | 0.0 /100 | #306 | Tragic 21.3% |
| Choctaw | 0.0 /100 | #307 | Tragic 21.3% |
| Immigrants | Mexico | 0.0 /100 | #308 | Tragic 21.5% |
| Seminole | 0.0 /100 | #309 | Tragic 21.5% |
| Creek | 0.0 /100 | #310 | Tragic 21.5% |
| Bahamians | 0.0 /100 | #311 | Tragic 21.6% |
| Immigrants | Guatemala | 0.0 /100 | #312 | Tragic 21.6% |
| British West Indians | 0.0 /100 | #313 | Tragic 21.6% |
| Ute | 0.0 /100 | #314 | Tragic 21.6% |
| Immigrants | Somalia | 0.0 /100 | #315 | Tragic 21.7% |
| Menominee | 0.0 /100 | #316 | Tragic 21.7% |
| Africans | 0.0 /100 | #317 | Tragic 21.7% |
| Yakama | 0.0 /100 | #318 | Tragic 21.7% |
Demographics Similar to Immigrants from Africa by Child Poverty Among Boys Under 16
In terms of child poverty among boys under 16, the demographic groups most similar to Immigrants from Africa are Bermudan (18.1%, a difference of 0.10%), Inupiat (18.1%, a difference of 0.16%), Nonimmigrants (18.2%, a difference of 0.43%), Nepalese (18.0%, a difference of 0.57%), and Immigrants from Micronesia (18.3%, a difference of 0.95%).
| Demographics | Rating | Rank | Child Poverty Among Boys Under 16 |
| Sierra Leoneans | 5.3 /100 | #219 | Tragic 17.8% |
| Immigrants | Cambodia | 5.1 /100 | #220 | Tragic 17.8% |
| Immigrants | Panama | 4.3 /100 | #221 | Tragic 17.9% |
| Pennsylvania Germans | 3.9 /100 | #222 | Tragic 17.9% |
| Cubans | 3.8 /100 | #223 | Tragic 17.9% |
| Nepalese | 3.2 /100 | #224 | Tragic 18.0% |
| Inupiat | 2.7 /100 | #225 | Tragic 18.1% |
| Immigrants | Africa | 2.6 /100 | #226 | Tragic 18.1% |
| Bermudans | 2.5 /100 | #227 | Tragic 18.1% |
| Immigrants | Nonimmigrants | 2.2 /100 | #228 | Tragic 18.2% |
| Immigrants | Micronesia | 1.8 /100 | #229 | Tragic 18.3% |
| Fijians | 1.8 /100 | #230 | Tragic 18.3% |
| Nicaraguans | 1.4 /100 | #231 | Tragic 18.4% |
| Marshallese | 1.3 /100 | #232 | Tragic 18.4% |
| Immigrants | Nigeria | 1.2 /100 | #233 | Tragic 18.4% |