Australian vs Immigrants from Belgium Child Poverty Under the Age of 16
COMPARE
Australian
Immigrants from Belgium
Child Poverty Under the Age of 16
Child Poverty Under the Age of 16 Comparison
Australians
Immigrants from Belgium
14.4%
CHILD POVERTY UNDER THE AGE OF 16
97.5/ 100
METRIC RATING
77th/ 347
METRIC RANK
14.1%
CHILD POVERTY UNDER THE AGE OF 16
98.6/ 100
METRIC RATING
57th/ 347
METRIC RANK
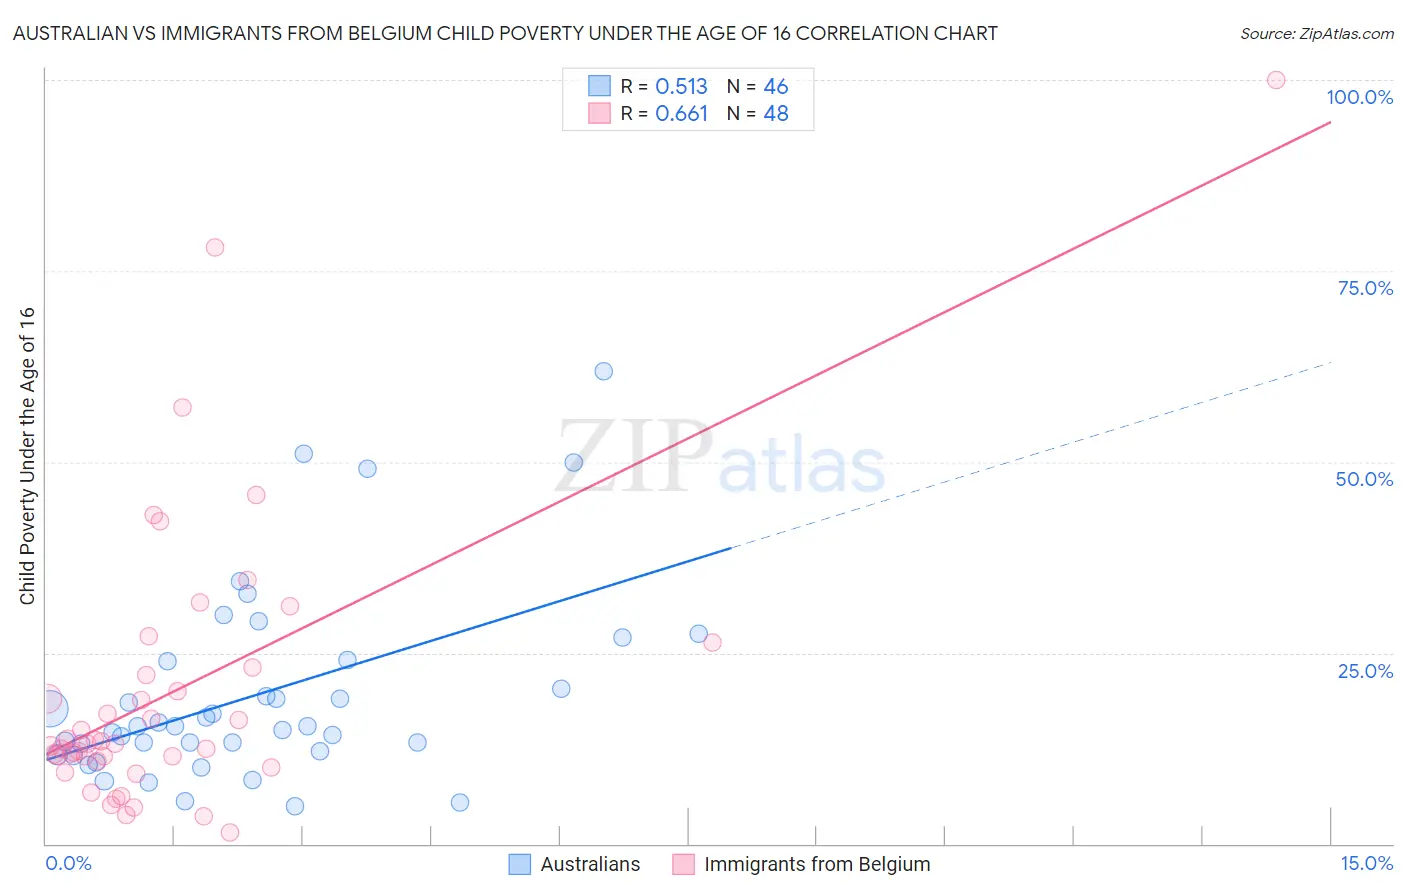
Australian vs Immigrants from Belgium Child Poverty Under the Age of 16 Correlation Chart
The statistical analysis conducted on geographies consisting of 222,609,541 people shows a substantial positive correlation between the proportion of Australians and poverty level among children under the age of 16 in the United States with a correlation coefficient (R) of 0.513 and weighted average of 14.4%. Similarly, the statistical analysis conducted on geographies consisting of 145,943,045 people shows a significant positive correlation between the proportion of Immigrants from Belgium and poverty level among children under the age of 16 in the United States with a correlation coefficient (R) of 0.661 and weighted average of 14.1%, a difference of 2.2%.
Child Poverty Under the Age of 16 Correlation Summary
| Measurement | Australian | Immigrants from Belgium |
| Minimum | 4.9% | 1.6% |
| Maximum | 61.8% | 100.0% |
| Range | 56.9% | 98.4% |
| Mean | 19.4% | 20.0% |
| Median | 15.4% | 13.1% |
| Interquartile 25% (IQ1) | 12.1% | 11.1% |
| Interquartile 75% (IQ3) | 23.8% | 22.5% |
| Interquartile Range (IQR) | 11.7% | 11.5% |
| Standard Deviation (Sample) | 12.6% | 18.9% |
| Standard Deviation (Population) | 12.5% | 18.7% |
Demographics Similar to Australians and Immigrants from Belgium by Child Poverty Under the Age of 16
In terms of child poverty under the age of 16, the demographic groups most similar to Australians are Immigrants from Eastern Europe (14.4%, a difference of 0.030%), Ukrainian (14.4%, a difference of 0.040%), Macedonian (14.4%, a difference of 0.24%), Immigrants from Turkey (14.4%, a difference of 0.25%), and Cambodian (14.4%, a difference of 0.46%). Similarly, the demographic groups most similar to Immigrants from Belgium are Immigrants from Pakistan (14.1%, a difference of 0.020%), Scandinavian (14.1%, a difference of 0.030%), Immigrants from Austria (14.2%, a difference of 0.22%), Immigrants from Sweden (14.2%, a difference of 0.26%), and Zimbabwean (14.2%, a difference of 0.27%).
| Demographics | Rating | Rank | Child Poverty Under the Age of 16 |
| Immigrants | Belgium | 98.6 /100 | #57 | Exceptional 14.1% |
| Immigrants | Pakistan | 98.6 /100 | #58 | Exceptional 14.1% |
| Scandinavians | 98.6 /100 | #59 | Exceptional 14.1% |
| Immigrants | Austria | 98.5 /100 | #60 | Exceptional 14.2% |
| Immigrants | Sweden | 98.5 /100 | #61 | Exceptional 14.2% |
| Zimbabweans | 98.5 /100 | #62 | Exceptional 14.2% |
| Immigrants | Europe | 98.4 /100 | #63 | Exceptional 14.2% |
| Immigrants | Romania | 98.3 /100 | #64 | Exceptional 14.2% |
| Immigrants | Philippines | 98.2 /100 | #65 | Exceptional 14.3% |
| Slovenes | 98.1 /100 | #66 | Exceptional 14.3% |
| Europeans | 98.1 /100 | #67 | Exceptional 14.3% |
| Laotians | 98.0 /100 | #68 | Exceptional 14.3% |
| Immigrants | Bulgaria | 98.0 /100 | #69 | Exceptional 14.3% |
| Immigrants | Netherlands | 97.9 /100 | #70 | Exceptional 14.3% |
| Immigrants | Poland | 97.9 /100 | #71 | Exceptional 14.3% |
| Cambodians | 97.8 /100 | #72 | Exceptional 14.4% |
| Immigrants | Turkey | 97.6 /100 | #73 | Exceptional 14.4% |
| Macedonians | 97.6 /100 | #74 | Exceptional 14.4% |
| Ukrainians | 97.5 /100 | #75 | Exceptional 14.4% |
| Immigrants | Eastern Europe | 97.5 /100 | #76 | Exceptional 14.4% |
| Australians | 97.5 /100 | #77 | Exceptional 14.4% |