Immigrants from Lithuania vs Subsaharan African Receiving Food Stamps
COMPARE
Immigrants from Lithuania
Subsaharan African
Receiving Food Stamps
Receiving Food Stamps Comparison
Immigrants from Lithuania
Sub-Saharan Africans
9.2%
RECEIVING FOOD STAMPS
99.8/ 100
METRIC RATING
29th/ 347
METRIC RANK
14.1%
RECEIVING FOOD STAMPS
0.3/ 100
METRIC RATING
255th/ 347
METRIC RANK
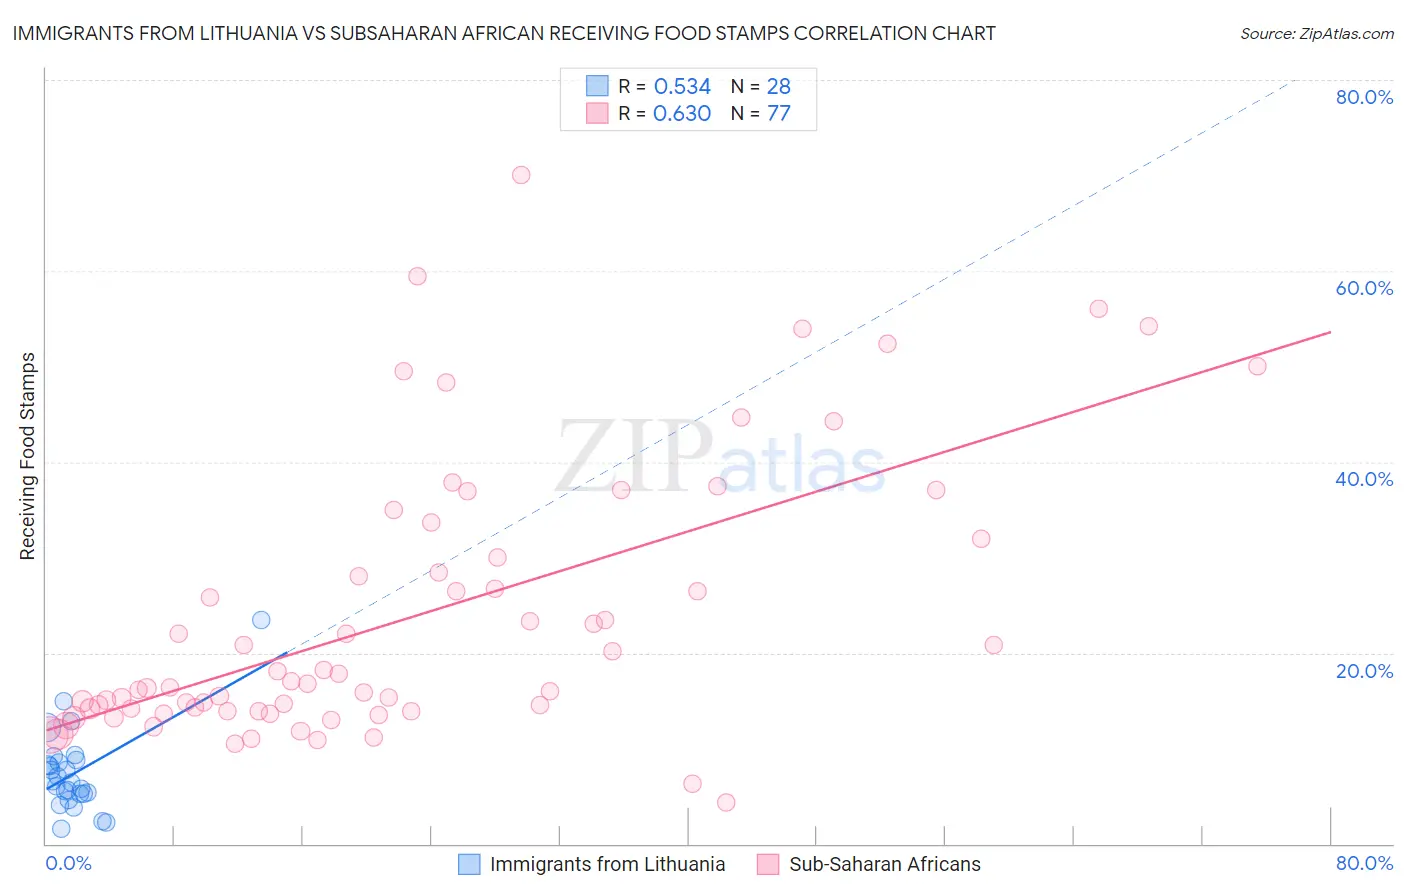
Immigrants from Lithuania vs Subsaharan African Receiving Food Stamps Correlation Chart
The statistical analysis conducted on geographies consisting of 117,609,856 people shows a substantial positive correlation between the proportion of Immigrants from Lithuania and percentage of population receiving government assistance and/or food stamps in the United States with a correlation coefficient (R) of 0.534 and weighted average of 9.2%. Similarly, the statistical analysis conducted on geographies consisting of 506,389,803 people shows a significant positive correlation between the proportion of Sub-Saharan Africans and percentage of population receiving government assistance and/or food stamps in the United States with a correlation coefficient (R) of 0.630 and weighted average of 14.1%, a difference of 52.4%.
Receiving Food Stamps Correlation Summary
| Measurement | Immigrants from Lithuania | Subsaharan African |
| Minimum | 1.6% | 4.3% |
| Maximum | 23.4% | 70.0% |
| Range | 21.8% | 65.7% |
| Mean | 7.4% | 23.8% |
| Median | 6.4% | 16.8% |
| Interquartile 25% (IQ1) | 5.2% | 13.9% |
| Interquartile 75% (IQ3) | 8.6% | 31.0% |
| Interquartile Range (IQR) | 3.4% | 17.1% |
| Standard Deviation (Sample) | 4.4% | 14.4% |
| Standard Deviation (Population) | 4.3% | 14.3% |
Similar Demographics by Receiving Food Stamps
Demographics Similar to Immigrants from Lithuania by Receiving Food Stamps
In terms of receiving food stamps, the demographic groups most similar to Immigrants from Lithuania are Czech (9.2%, a difference of 0.27%), Bhutanese (9.2%, a difference of 0.28%), Immigrants from Sweden (9.3%, a difference of 0.37%), Swedish (9.2%, a difference of 0.52%), and Immigrants from Ireland (9.2%, a difference of 0.72%).
| Demographics | Rating | Rank | Receiving Food Stamps |
| Immigrants | Australia | 99.8 /100 | #22 | Exceptional 9.2% |
| Eastern Europeans | 99.8 /100 | #23 | Exceptional 9.2% |
| Immigrants | Northern Europe | 99.8 /100 | #24 | Exceptional 9.2% |
| Immigrants | Ireland | 99.8 /100 | #25 | Exceptional 9.2% |
| Swedes | 99.8 /100 | #26 | Exceptional 9.2% |
| Bhutanese | 99.8 /100 | #27 | Exceptional 9.2% |
| Czechs | 99.8 /100 | #28 | Exceptional 9.2% |
| Immigrants | Lithuania | 99.8 /100 | #29 | Exceptional 9.2% |
| Immigrants | Sweden | 99.7 /100 | #30 | Exceptional 9.3% |
| Immigrants | Eastern Asia | 99.7 /100 | #31 | Exceptional 9.3% |
| Bolivians | 99.7 /100 | #32 | Exceptional 9.3% |
| Zimbabweans | 99.6 /100 | #33 | Exceptional 9.5% |
| Turks | 99.6 /100 | #34 | Exceptional 9.5% |
| Immigrants | Austria | 99.6 /100 | #35 | Exceptional 9.5% |
| Estonians | 99.6 /100 | #36 | Exceptional 9.5% |
Demographics Similar to Sub-Saharan Africans by Receiving Food Stamps
In terms of receiving food stamps, the demographic groups most similar to Sub-Saharan Africans are Marshallese (14.1%, a difference of 0.010%), Japanese (14.1%, a difference of 0.020%), Arapaho (14.1%, a difference of 0.12%), Immigrants from Ghana (14.1%, a difference of 0.20%), and Creek (14.1%, a difference of 0.33%).
| Demographics | Rating | Rank | Receiving Food Stamps |
| Immigrants | Laos | 0.7 /100 | #248 | Tragic 13.8% |
| Indonesians | 0.6 /100 | #249 | Tragic 13.9% |
| Immigrants | Cambodia | 0.5 /100 | #250 | Tragic 13.9% |
| Yaqui | 0.5 /100 | #251 | Tragic 13.9% |
| Ghanaians | 0.5 /100 | #252 | Tragic 14.0% |
| Spanish Americans | 0.4 /100 | #253 | Tragic 14.0% |
| Marshallese | 0.3 /100 | #254 | Tragic 14.1% |
| Sub-Saharan Africans | 0.3 /100 | #255 | Tragic 14.1% |
| Japanese | 0.3 /100 | #256 | Tragic 14.1% |
| Arapaho | 0.3 /100 | #257 | Tragic 14.1% |
| Immigrants | Ghana | 0.3 /100 | #258 | Tragic 14.1% |
| Creek | 0.3 /100 | #259 | Tragic 14.1% |
| Central Americans | 0.3 /100 | #260 | Tragic 14.1% |
| Immigrants | Congo | 0.3 /100 | #261 | Tragic 14.1% |
| Paiute | 0.2 /100 | #262 | Tragic 14.3% |