Asian vs Immigrants from Somalia 1st Grade
COMPARE
Asian
Immigrants from Somalia
1st Grade
1st Grade Comparison
Asians
Immigrants from Somalia
97.6%
1ST GRADE
1.1/ 100
METRIC RATING
244th/ 347
METRIC RANK
96.9%
1ST GRADE
0.0/ 100
METRIC RATING
307th/ 347
METRIC RANK
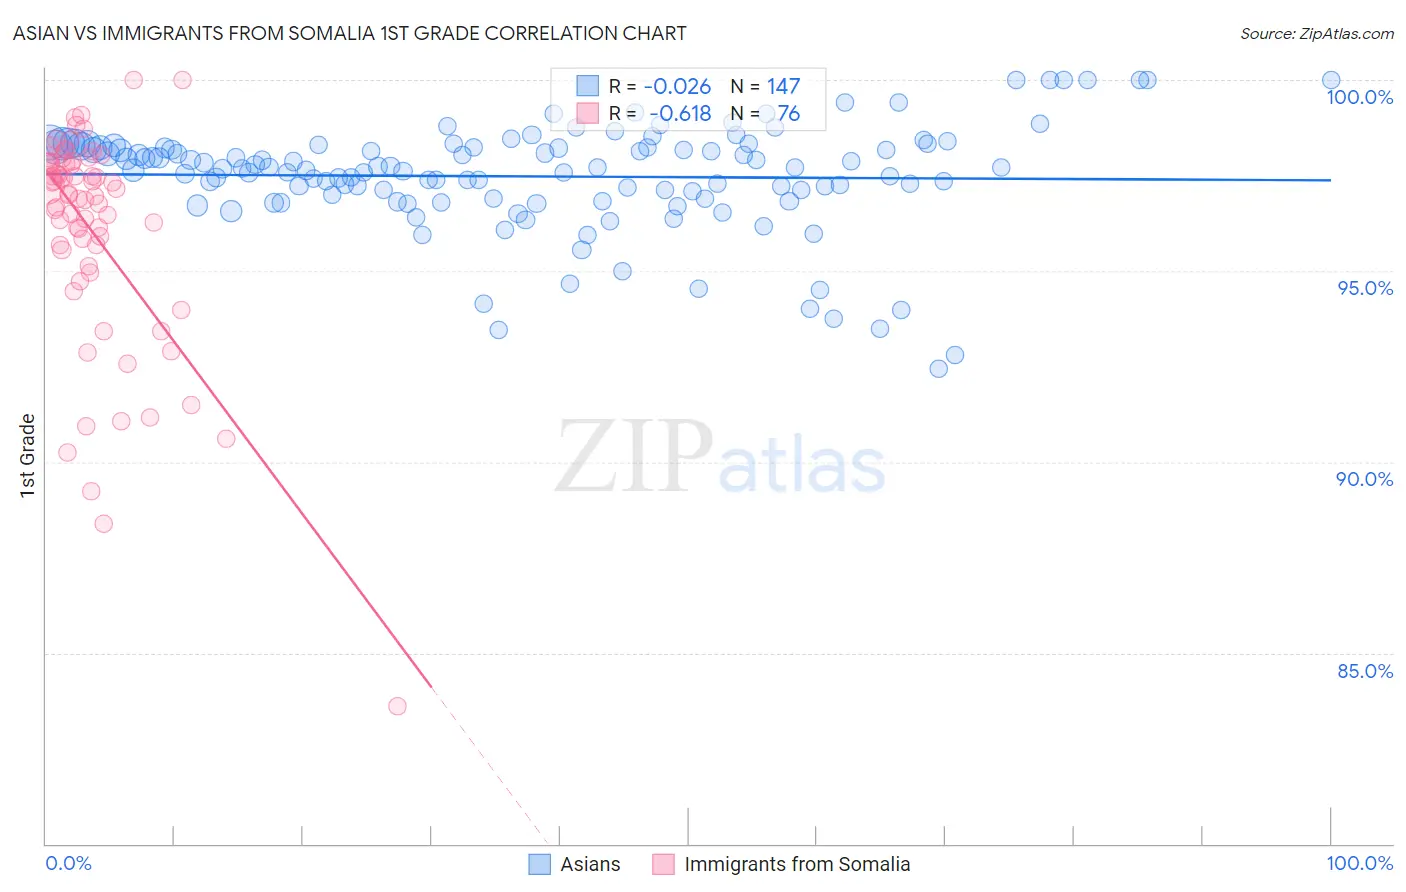
Asian vs Immigrants from Somalia 1st Grade Correlation Chart
The statistical analysis conducted on geographies consisting of 550,722,447 people shows no correlation between the proportion of Asians and percentage of population with at least 1st grade education in the United States with a correlation coefficient (R) of -0.026 and weighted average of 97.6%. Similarly, the statistical analysis conducted on geographies consisting of 92,111,755 people shows a significant negative correlation between the proportion of Immigrants from Somalia and percentage of population with at least 1st grade education in the United States with a correlation coefficient (R) of -0.618 and weighted average of 96.9%, a difference of 0.66%.
1st Grade Correlation Summary
| Measurement | Asian | Immigrants from Somalia |
| Minimum | 92.4% | 83.6% |
| Maximum | 100.0% | 100.0% |
| Range | 7.6% | 16.4% |
| Mean | 97.5% | 96.0% |
| Median | 97.7% | 97.0% |
| Interquartile 25% (IQ1) | 96.9% | 95.3% |
| Interquartile 75% (IQ3) | 98.2% | 97.8% |
| Interquartile Range (IQR) | 1.3% | 2.5% |
| Standard Deviation (Sample) | 1.4% | 2.9% |
| Standard Deviation (Population) | 1.4% | 2.9% |
Similar Demographics by 1st Grade
Demographics Similar to Asians by 1st Grade
In terms of 1st grade, the demographic groups most similar to Asians are South American (97.6%, a difference of 0.0%), Immigrants from Eastern Africa (97.6%, a difference of 0.0%), Immigrants from Indonesia (97.6%, a difference of 0.010%), Bolivian (97.6%, a difference of 0.010%), and Peruvian (97.6%, a difference of 0.010%).
| Demographics | Rating | Rank | 1st Grade |
| U.S. Virgin Islanders | 1.9 /100 | #237 | Tragic 97.6% |
| Nigerians | 1.8 /100 | #238 | Tragic 97.6% |
| Immigrants | Eastern Asia | 1.6 /100 | #239 | Tragic 97.6% |
| Koreans | 1.5 /100 | #240 | Tragic 97.6% |
| Liberians | 1.4 /100 | #241 | Tragic 97.6% |
| Immigrants | Indonesia | 1.2 /100 | #242 | Tragic 97.6% |
| Bolivians | 1.2 /100 | #243 | Tragic 97.6% |
| Asians | 1.1 /100 | #244 | Tragic 97.6% |
| South Americans | 1.1 /100 | #245 | Tragic 97.6% |
| Immigrants | Eastern Africa | 1.0 /100 | #246 | Tragic 97.6% |
| Peruvians | 1.0 /100 | #247 | Tragic 97.6% |
| Immigrants | Middle Africa | 1.0 /100 | #248 | Tragic 97.6% |
| Immigrants | Senegal | 1.0 /100 | #249 | Tragic 97.6% |
| Ethiopians | 0.9 /100 | #250 | Tragic 97.6% |
| Immigrants | Iraq | 0.9 /100 | #251 | Tragic 97.6% |
Demographics Similar to Immigrants from Somalia by 1st Grade
In terms of 1st grade, the demographic groups most similar to Immigrants from Somalia are Hispanic or Latino (96.9%, a difference of 0.0%), Belizean (96.9%, a difference of 0.010%), Immigrants from Haiti (96.9%, a difference of 0.010%), Immigrants from the Azores (96.9%, a difference of 0.010%), and Sri Lankan (96.9%, a difference of 0.030%).
| Demographics | Rating | Rank | 1st Grade |
| Haitians | 0.0 /100 | #300 | Tragic 97.1% |
| Immigrants | South Eastern Asia | 0.0 /100 | #301 | Tragic 97.1% |
| Immigrants | Caribbean | 0.0 /100 | #302 | Tragic 97.0% |
| Somalis | 0.0 /100 | #303 | Tragic 97.0% |
| Nicaraguans | 0.0 /100 | #304 | Tragic 97.0% |
| Ecuadorians | 0.0 /100 | #305 | Tragic 97.0% |
| Belizeans | 0.0 /100 | #306 | Tragic 96.9% |
| Immigrants | Somalia | 0.0 /100 | #307 | Tragic 96.9% |
| Hispanics or Latinos | 0.0 /100 | #308 | Tragic 96.9% |
| Immigrants | Haiti | 0.0 /100 | #309 | Tragic 96.9% |
| Immigrants | Azores | 0.0 /100 | #310 | Tragic 96.9% |
| Sri Lankans | 0.0 /100 | #311 | Tragic 96.9% |
| Cape Verdeans | 0.0 /100 | #312 | Tragic 96.9% |
| Guyanese | 0.0 /100 | #313 | Tragic 96.9% |
| Hondurans | 0.0 /100 | #314 | Tragic 96.9% |