Armenian vs Belgian Child Poverty Under the Age of 16
COMPARE
Armenian
Belgian
Child Poverty Under the Age of 16
Child Poverty Under the Age of 16 Comparison
Armenians
Belgians
15.2%
CHILD POVERTY UNDER THE AGE OF 16
89.4/ 100
METRIC RATING
131st/ 347
METRIC RANK
14.9%
CHILD POVERTY UNDER THE AGE OF 16
93.3/ 100
METRIC RATING
113th/ 347
METRIC RANK
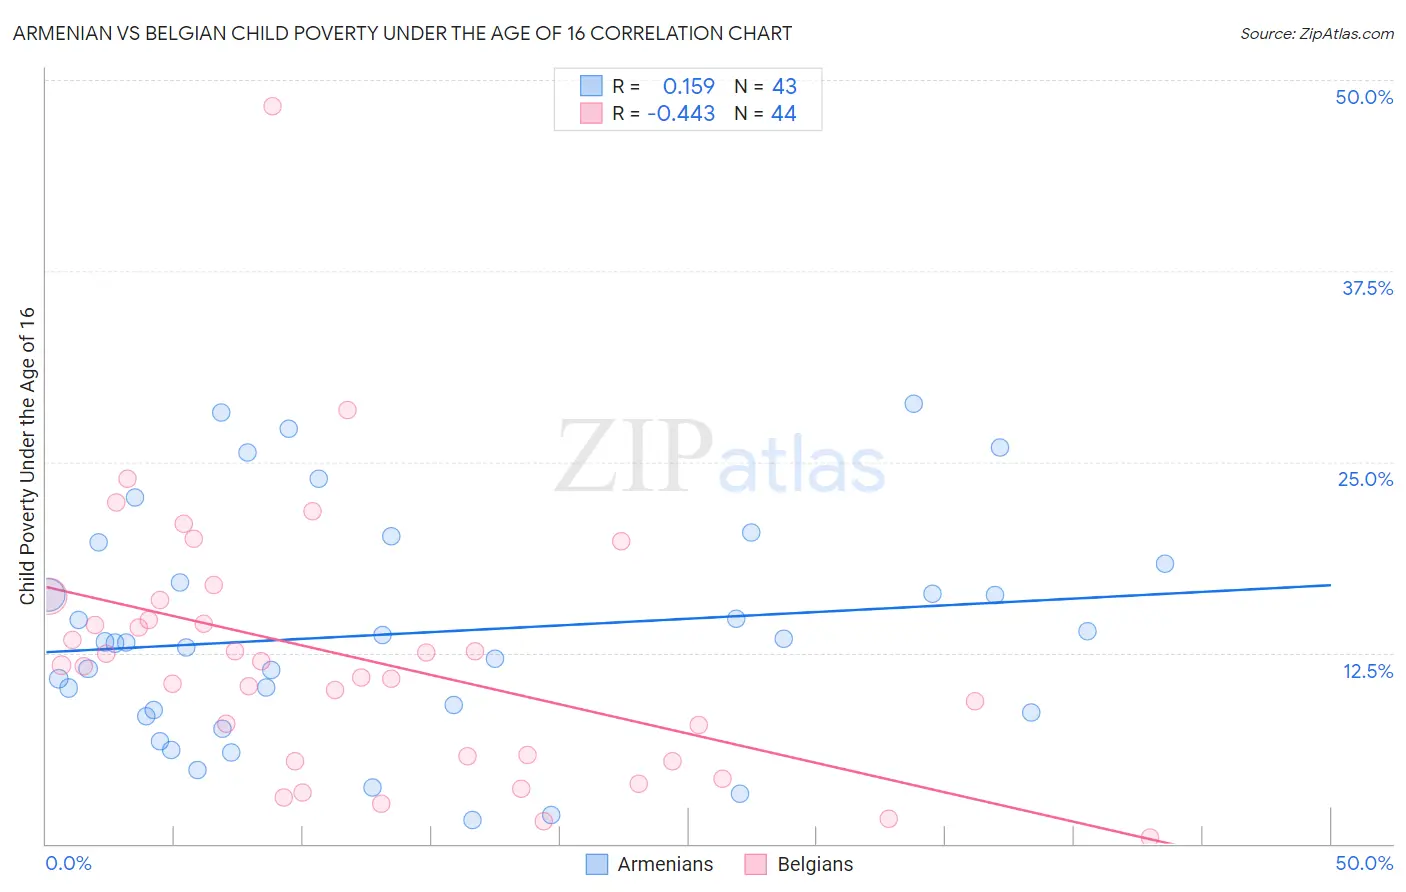
Armenian vs Belgian Child Poverty Under the Age of 16 Correlation Chart
The statistical analysis conducted on geographies consisting of 307,876,845 people shows a poor positive correlation between the proportion of Armenians and poverty level among children under the age of 16 in the United States with a correlation coefficient (R) of 0.159 and weighted average of 15.2%. Similarly, the statistical analysis conducted on geographies consisting of 352,322,898 people shows a moderate negative correlation between the proportion of Belgians and poverty level among children under the age of 16 in the United States with a correlation coefficient (R) of -0.443 and weighted average of 14.9%, a difference of 1.6%.
Child Poverty Under the Age of 16 Correlation Summary
| Measurement | Armenian | Belgian |
| Minimum | 1.5% | 0.43% |
| Maximum | 28.8% | 48.3% |
| Range | 27.3% | 47.9% |
| Mean | 13.8% | 12.2% |
| Median | 13.2% | 11.6% |
| Interquartile 25% (IQ1) | 8.6% | 5.5% |
| Interquartile 75% (IQ3) | 18.3% | 15.3% |
| Interquartile Range (IQR) | 9.8% | 9.8% |
| Standard Deviation (Sample) | 7.2% | 8.7% |
| Standard Deviation (Population) | 7.2% | 8.6% |
Demographics Similar to Armenians and Belgians by Child Poverty Under the Age of 16
In terms of child poverty under the age of 16, the demographic groups most similar to Armenians are Mongolian (15.2%, a difference of 0.030%), Canadian (15.2%, a difference of 0.090%), Immigrants from Southern Europe (15.1%, a difference of 0.12%), Immigrants from Kazakhstan (15.1%, a difference of 0.28%), and Immigrants from Western Europe (15.1%, a difference of 0.33%). Similarly, the demographic groups most similar to Belgians are Sri Lankan (14.9%, a difference of 0.030%), Irish (14.9%, a difference of 0.040%), Immigrants from Ukraine (14.9%, a difference of 0.090%), Carpatho Rusyn (14.9%, a difference of 0.11%), and Immigrants from Norway (15.0%, a difference of 0.26%).
| Demographics | Rating | Rank | Child Poverty Under the Age of 16 |
| Irish | 93.4 /100 | #112 | Exceptional 14.9% |
| Belgians | 93.3 /100 | #113 | Exceptional 14.9% |
| Sri Lankans | 93.2 /100 | #114 | Exceptional 14.9% |
| Immigrants | Ukraine | 93.1 /100 | #115 | Exceptional 14.9% |
| Carpatho Rusyns | 93.1 /100 | #116 | Exceptional 14.9% |
| Immigrants | Norway | 92.8 /100 | #117 | Exceptional 15.0% |
| Immigrants | Malaysia | 92.6 /100 | #118 | Exceptional 15.0% |
| Scottish | 92.3 /100 | #119 | Exceptional 15.0% |
| South Africans | 92.1 /100 | #120 | Exceptional 15.0% |
| Immigrants | Zimbabwe | 92.1 /100 | #121 | Exceptional 15.0% |
| Pakistanis | 91.7 /100 | #122 | Exceptional 15.0% |
| Immigrants | Brazil | 91.1 /100 | #123 | Exceptional 15.1% |
| Czechoslovakians | 91.0 /100 | #124 | Exceptional 15.1% |
| Palestinians | 90.9 /100 | #125 | Exceptional 15.1% |
| Portuguese | 90.6 /100 | #126 | Exceptional 15.1% |
| Immigrants | Western Europe | 90.3 /100 | #127 | Exceptional 15.1% |
| Immigrants | Kazakhstan | 90.2 /100 | #128 | Exceptional 15.1% |
| Immigrants | Southern Europe | 89.7 /100 | #129 | Excellent 15.1% |
| Mongolians | 89.5 /100 | #130 | Excellent 15.2% |
| Armenians | 89.4 /100 | #131 | Excellent 15.2% |
| Canadians | 89.1 /100 | #132 | Excellent 15.2% |