Immigrants from Kenya vs Immigrants from Congo Child Poverty Under the Age of 16
COMPARE
Immigrants from Kenya
Immigrants from Congo
Child Poverty Under the Age of 16
Child Poverty Under the Age of 16 Comparison
Immigrants from Kenya
Immigrants from Congo
16.9%
CHILD POVERTY UNDER THE AGE OF 16
19.1/ 100
METRIC RATING
197th/ 347
METRIC RANK
22.5%
CHILD POVERTY UNDER THE AGE OF 16
0.0/ 100
METRIC RATING
325th/ 347
METRIC RANK
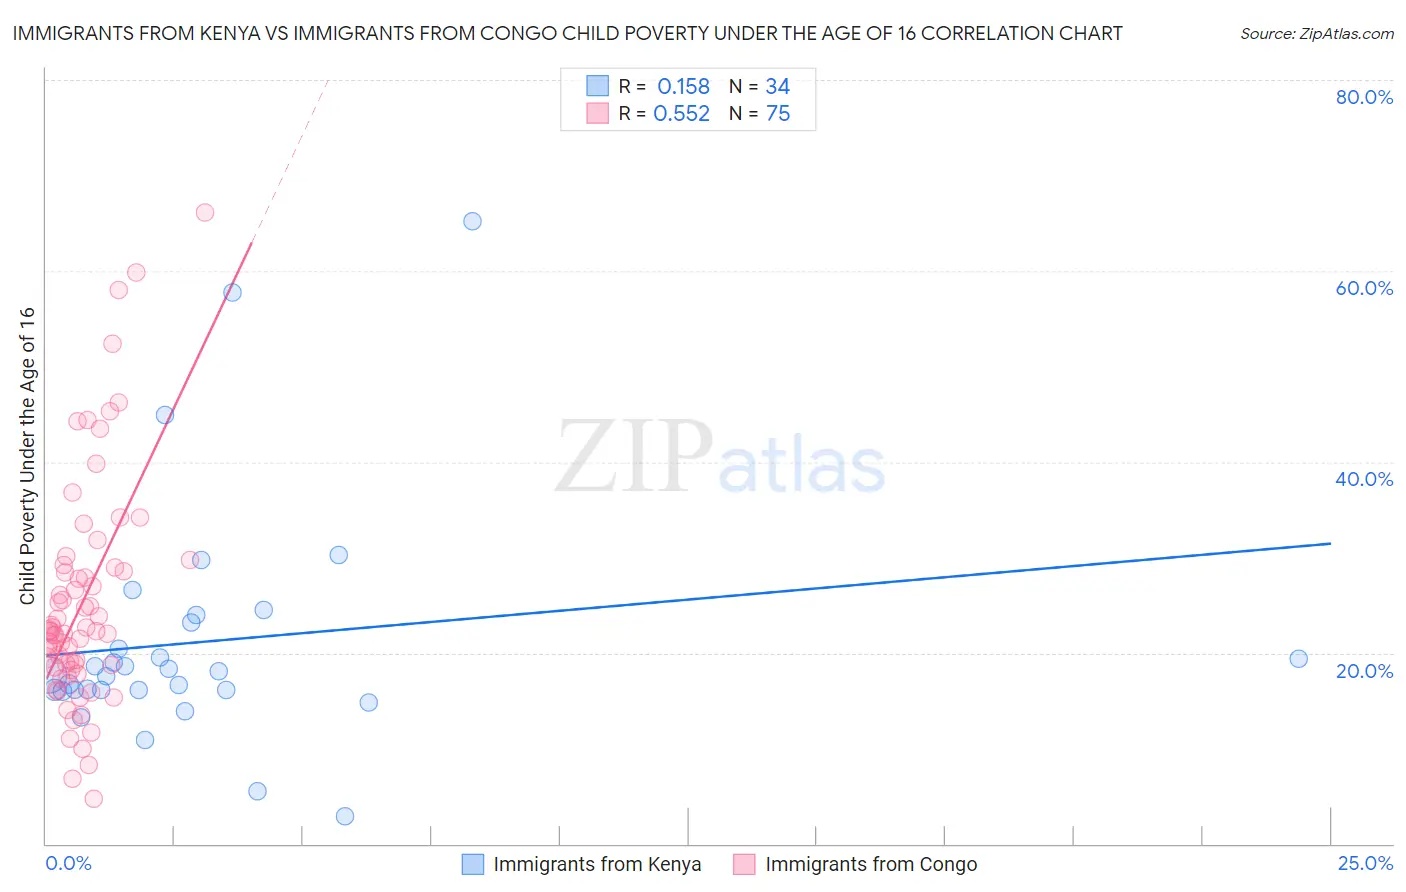
Immigrants from Kenya vs Immigrants from Congo Child Poverty Under the Age of 16 Correlation Chart
The statistical analysis conducted on geographies consisting of 217,344,865 people shows a poor positive correlation between the proportion of Immigrants from Kenya and poverty level among children under the age of 16 in the United States with a correlation coefficient (R) of 0.158 and weighted average of 16.9%. Similarly, the statistical analysis conducted on geographies consisting of 92,037,076 people shows a substantial positive correlation between the proportion of Immigrants from Congo and poverty level among children under the age of 16 in the United States with a correlation coefficient (R) of 0.552 and weighted average of 22.5%, a difference of 33.3%.
Child Poverty Under the Age of 16 Correlation Summary
| Measurement | Immigrants from Kenya | Immigrants from Congo |
| Minimum | 2.8% | 4.7% |
| Maximum | 65.2% | 66.1% |
| Range | 62.4% | 61.5% |
| Mean | 21.2% | 25.3% |
| Median | 17.9% | 22.2% |
| Interquartile 25% (IQ1) | 16.1% | 18.5% |
| Interquartile 75% (IQ3) | 23.1% | 28.9% |
| Interquartile Range (IQR) | 7.1% | 10.4% |
| Standard Deviation (Sample) | 12.5% | 12.0% |
| Standard Deviation (Population) | 12.3% | 11.9% |
Similar Demographics by Child Poverty Under the Age of 16
Demographics Similar to Immigrants from Kenya by Child Poverty Under the Age of 16
In terms of child poverty under the age of 16, the demographic groups most similar to Immigrants from Kenya are Delaware (17.0%, a difference of 0.40%), Immigrants from Lebanon (16.8%, a difference of 0.52%), Immigrants from Uganda (16.8%, a difference of 0.60%), Immigrants from Uruguay (16.8%, a difference of 0.69%), and Spaniard (16.8%, a difference of 0.71%).
| Demographics | Rating | Rank | Child Poverty Under the Age of 16 |
| Immigrants | Costa Rica | 29.6 /100 | #190 | Fair 16.6% |
| Immigrants | Iraq | 28.3 /100 | #191 | Fair 16.7% |
| Spanish | 24.5 /100 | #192 | Fair 16.7% |
| Spaniards | 23.2 /100 | #193 | Fair 16.8% |
| Immigrants | Uruguay | 23.1 /100 | #194 | Fair 16.8% |
| Immigrants | Uganda | 22.5 /100 | #195 | Fair 16.8% |
| Immigrants | Lebanon | 22.0 /100 | #196 | Fair 16.8% |
| Immigrants | Kenya | 19.1 /100 | #197 | Poor 16.9% |
| Delaware | 17.1 /100 | #198 | Poor 17.0% |
| Immigrants | Afghanistan | 15.1 /100 | #199 | Poor 17.0% |
| Immigrants | Cameroon | 14.7 /100 | #200 | Poor 17.1% |
| Immigrants | Uzbekistan | 14.7 /100 | #201 | Poor 17.1% |
| Ugandans | 14.3 /100 | #202 | Poor 17.1% |
| Immigrants | Sierra Leone | 14.2 /100 | #203 | Poor 17.1% |
| Hmong | 14.0 /100 | #204 | Poor 17.1% |
Demographics Similar to Immigrants from Congo by Child Poverty Under the Age of 16
In terms of child poverty under the age of 16, the demographic groups most similar to Immigrants from Congo are Central American Indian (22.5%, a difference of 0.14%), Paiute (22.4%, a difference of 0.45%), Immigrants from Honduras (22.7%, a difference of 0.81%), Honduran (22.2%, a difference of 1.5%), and Kiowa (22.2%, a difference of 1.7%).
| Demographics | Rating | Rank | Child Poverty Under the Age of 16 |
| U.S. Virgin Islanders | 0.0 /100 | #318 | Tragic 22.0% |
| Yakama | 0.0 /100 | #319 | Tragic 22.1% |
| Cajuns | 0.0 /100 | #320 | Tragic 22.1% |
| Kiowa | 0.0 /100 | #321 | Tragic 22.2% |
| Hondurans | 0.0 /100 | #322 | Tragic 22.2% |
| Paiute | 0.0 /100 | #323 | Tragic 22.4% |
| Central American Indians | 0.0 /100 | #324 | Tragic 22.5% |
| Immigrants | Congo | 0.0 /100 | #325 | Tragic 22.5% |
| Immigrants | Honduras | 0.0 /100 | #326 | Tragic 22.7% |
| Menominee | 0.0 /100 | #327 | Tragic 23.0% |
| Colville | 0.0 /100 | #328 | Tragic 23.0% |
| Dominicans | 0.0 /100 | #329 | Tragic 23.8% |
| Natives/Alaskans | 0.0 /100 | #330 | Tragic 23.8% |
| Apache | 0.0 /100 | #331 | Tragic 23.8% |
| Pueblo | 0.0 /100 | #332 | Tragic 23.9% |