Immigrants from Cameroon vs Alaska Native Seniors Poverty Over the Age of 65
COMPARE
Immigrants from Cameroon
Alaska Native
Seniors Poverty Over the Age of 65
Seniors Poverty Over the Age of 65 Comparison
Immigrants from Cameroon
Alaska Natives
10.6%
SENIORS POVERTY OVER THE AGE OF 65
78.1/ 100
METRIC RATING
149th/ 347
METRIC RANK
10.8%
SENIORS POVERTY OVER THE AGE OF 65
60.3/ 100
METRIC RATING
167th/ 347
METRIC RANK
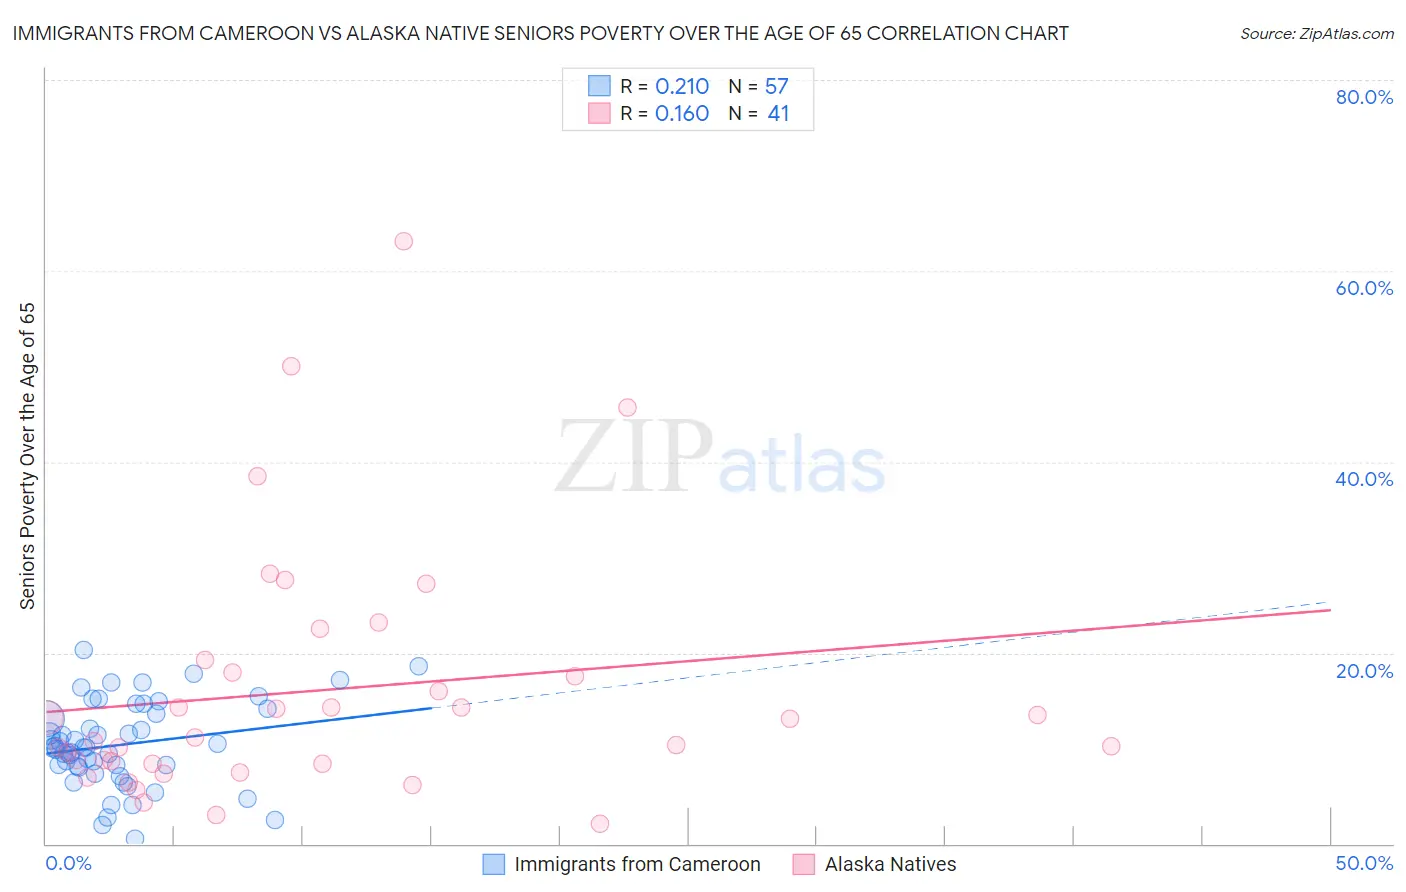
Immigrants from Cameroon vs Alaska Native Seniors Poverty Over the Age of 65 Correlation Chart
The statistical analysis conducted on geographies consisting of 130,481,344 people shows a weak positive correlation between the proportion of Immigrants from Cameroon and poverty level among seniors over the age of 65 in the United States with a correlation coefficient (R) of 0.210 and weighted average of 10.6%. Similarly, the statistical analysis conducted on geographies consisting of 76,614,353 people shows a poor positive correlation between the proportion of Alaska Natives and poverty level among seniors over the age of 65 in the United States with a correlation coefficient (R) of 0.160 and weighted average of 10.8%, a difference of 1.9%.
Seniors Poverty Over the Age of 65 Correlation Summary
| Measurement | Immigrants from Cameroon | Alaska Native |
| Minimum | 0.58% | 2.0% |
| Maximum | 20.3% | 63.2% |
| Range | 19.7% | 61.1% |
| Mean | 10.4% | 16.1% |
| Median | 10.0% | 11.1% |
| Interquartile 25% (IQ1) | 8.1% | 8.4% |
| Interquartile 75% (IQ3) | 13.9% | 18.6% |
| Interquartile Range (IQR) | 5.9% | 10.2% |
| Standard Deviation (Sample) | 4.4% | 13.1% |
| Standard Deviation (Population) | 4.4% | 12.9% |
Demographics Similar to Immigrants from Cameroon and Alaska Natives by Seniors Poverty Over the Age of 65
In terms of seniors poverty over the age of 65, the demographic groups most similar to Immigrants from Cameroon are American (10.6%, a difference of 0.0%), Immigrants from Switzerland (10.6%, a difference of 0.10%), Spanish (10.6%, a difference of 0.16%), Immigrants from Egypt (10.6%, a difference of 0.21%), and Fijian (10.7%, a difference of 0.32%). Similarly, the demographic groups most similar to Alaska Natives are Malaysian (10.8%, a difference of 0.16%), Immigrants from South Eastern Asia (10.8%, a difference of 0.17%), Potawatomi (10.8%, a difference of 0.22%), Mongolian (10.9%, a difference of 0.22%), and Tsimshian (10.8%, a difference of 0.40%).
| Demographics | Rating | Rank | Seniors Poverty Over the Age of 65 |
| Americans | 78.1 /100 | #148 | Good 10.6% |
| Immigrants | Cameroon | 78.1 /100 | #149 | Good 10.6% |
| Immigrants | Switzerland | 77.3 /100 | #150 | Good 10.6% |
| Spanish | 76.8 /100 | #151 | Good 10.6% |
| Immigrants | Egypt | 76.5 /100 | #152 | Good 10.6% |
| Fijians | 75.6 /100 | #153 | Good 10.7% |
| Immigrants | Saudi Arabia | 74.9 /100 | #154 | Good 10.7% |
| Chickasaw | 73.6 /100 | #155 | Good 10.7% |
| Ethiopians | 72.9 /100 | #156 | Good 10.7% |
| Immigrants | Ethiopia | 72.9 /100 | #157 | Good 10.7% |
| Immigrants | Sierra Leone | 71.7 /100 | #158 | Good 10.7% |
| Immigrants | Micronesia | 70.8 /100 | #159 | Good 10.7% |
| Sudanese | 68.2 /100 | #160 | Good 10.7% |
| Arabs | 65.2 /100 | #161 | Good 10.8% |
| Immigrants | Indonesia | 64.8 /100 | #162 | Good 10.8% |
| Tsimshian | 64.5 /100 | #163 | Good 10.8% |
| Potawatomi | 62.6 /100 | #164 | Good 10.8% |
| Immigrants | South Eastern Asia | 62.1 /100 | #165 | Good 10.8% |
| Malaysians | 62.0 /100 | #166 | Good 10.8% |
| Alaska Natives | 60.3 /100 | #167 | Good 10.8% |
| Mongolians | 58.0 /100 | #168 | Average 10.9% |