Immigrants from Central America vs Immigrants from Trinidad and Tobago Child Poverty Under the Age of 16
COMPARE
Immigrants from Central America
Immigrants from Trinidad and Tobago
Child Poverty Under the Age of 16
Child Poverty Under the Age of 16 Comparison
Immigrants from Central America
Immigrants from Trinidad and Tobago
21.3%
CHILD POVERTY UNDER THE AGE OF 16
0.0/ 100
METRIC RATING
307th/ 347
METRIC RANK
19.1%
CHILD POVERTY UNDER THE AGE OF 16
0.3/ 100
METRIC RATING
252nd/ 347
METRIC RANK
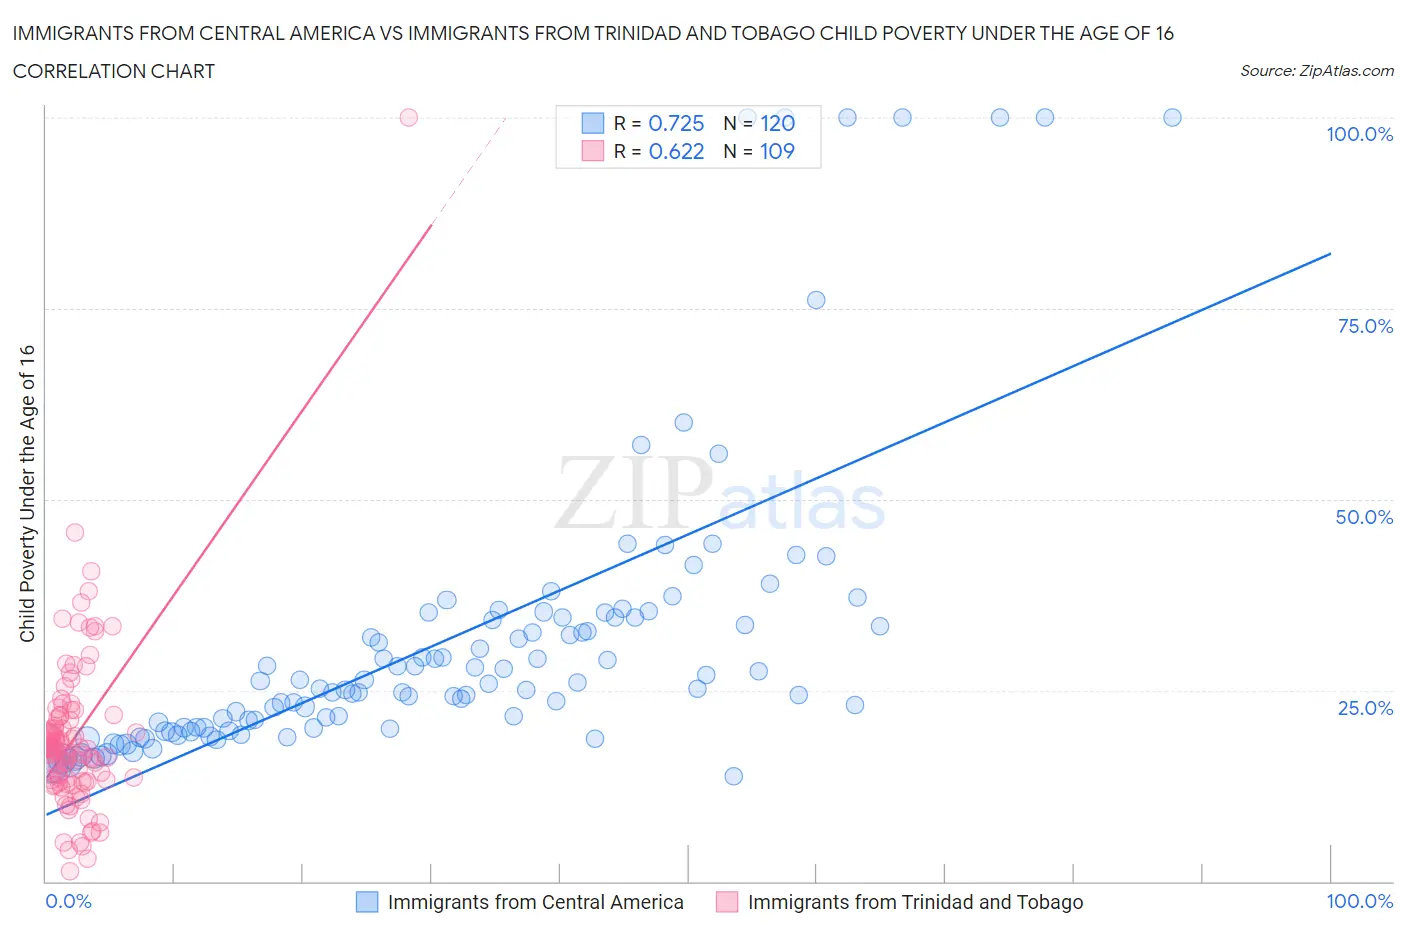
Immigrants from Central America vs Immigrants from Trinidad and Tobago Child Poverty Under the Age of 16 Correlation Chart
The statistical analysis conducted on geographies consisting of 528,817,501 people shows a strong positive correlation between the proportion of Immigrants from Central America and poverty level among children under the age of 16 in the United States with a correlation coefficient (R) of 0.725 and weighted average of 21.3%. Similarly, the statistical analysis conducted on geographies consisting of 222,555,778 people shows a significant positive correlation between the proportion of Immigrants from Trinidad and Tobago and poverty level among children under the age of 16 in the United States with a correlation coefficient (R) of 0.622 and weighted average of 19.1%, a difference of 11.4%.
Child Poverty Under the Age of 16 Correlation Summary
| Measurement | Immigrants from Central America | Immigrants from Trinidad and Tobago |
| Minimum | 13.8% | 1.3% |
| Maximum | 100.0% | 100.0% |
| Range | 86.2% | 98.7% |
| Mean | 31.6% | 18.8% |
| Median | 25.5% | 17.4% |
| Interquartile 25% (IQ1) | 20.1% | 13.2% |
| Interquartile 75% (IQ3) | 34.5% | 21.5% |
| Interquartile Range (IQR) | 14.4% | 8.3% |
| Standard Deviation (Sample) | 19.7% | 11.3% |
| Standard Deviation (Population) | 19.6% | 11.2% |
Similar Demographics by Child Poverty Under the Age of 16
Demographics Similar to Immigrants from Central America by Child Poverty Under the Age of 16
In terms of child poverty under the age of 16, the demographic groups most similar to Immigrants from Central America are British West Indian (21.3%, a difference of 0.29%), Guatemalan (21.2%, a difference of 0.41%), Seminole (21.1%, a difference of 0.57%), Immigrants from Mexico (21.5%, a difference of 0.94%), and Bahamian (21.5%, a difference of 0.96%).
| Demographics | Rating | Rank | Child Poverty Under the Age of 16 |
| Indonesians | 0.0 /100 | #300 | Tragic 21.0% |
| Immigrants | Grenada | 0.0 /100 | #301 | Tragic 21.0% |
| Immigrants | Bahamas | 0.0 /100 | #302 | Tragic 21.0% |
| Choctaw | 0.0 /100 | #303 | Tragic 21.0% |
| Somalis | 0.0 /100 | #304 | Tragic 21.0% |
| Seminole | 0.0 /100 | #305 | Tragic 21.1% |
| Guatemalans | 0.0 /100 | #306 | Tragic 21.2% |
| Immigrants | Central America | 0.0 /100 | #307 | Tragic 21.3% |
| British West Indians | 0.0 /100 | #308 | Tragic 21.3% |
| Immigrants | Mexico | 0.0 /100 | #309 | Tragic 21.5% |
| Bahamians | 0.0 /100 | #310 | Tragic 21.5% |
| Dutch West Indians | 0.0 /100 | #311 | Tragic 21.5% |
| Ute | 0.0 /100 | #312 | Tragic 21.5% |
| Creek | 0.0 /100 | #313 | Tragic 21.5% |
| Immigrants | Somalia | 0.0 /100 | #314 | Tragic 21.6% |
Demographics Similar to Immigrants from Trinidad and Tobago by Child Poverty Under the Age of 16
In terms of child poverty under the age of 16, the demographic groups most similar to Immigrants from Trinidad and Tobago are Immigrants from Ghana (19.1%, a difference of 0.070%), Salvadoran (19.1%, a difference of 0.19%), Immigrants from Middle Africa (19.0%, a difference of 0.23%), Potawatomi (19.0%, a difference of 0.43%), and Immigrants from Western Africa (19.2%, a difference of 0.44%).
| Demographics | Rating | Rank | Child Poverty Under the Age of 16 |
| Shoshone | 0.5 /100 | #245 | Tragic 18.8% |
| Immigrants | Nicaragua | 0.4 /100 | #246 | Tragic 18.8% |
| French American Indians | 0.4 /100 | #247 | Tragic 18.9% |
| Ecuadorians | 0.3 /100 | #248 | Tragic 19.0% |
| Potawatomi | 0.3 /100 | #249 | Tragic 19.0% |
| Immigrants | Middle Africa | 0.3 /100 | #250 | Tragic 19.0% |
| Immigrants | Ghana | 0.3 /100 | #251 | Tragic 19.1% |
| Immigrants | Trinidad and Tobago | 0.3 /100 | #252 | Tragic 19.1% |
| Salvadorans | 0.3 /100 | #253 | Tragic 19.1% |
| Immigrants | Western Africa | 0.2 /100 | #254 | Tragic 19.2% |
| Trinidadians and Tobagonians | 0.2 /100 | #255 | Tragic 19.2% |
| Inupiat | 0.2 /100 | #256 | Tragic 19.2% |
| Ottawa | 0.2 /100 | #257 | Tragic 19.2% |
| Spanish Americans | 0.2 /100 | #258 | Tragic 19.2% |
| Mexican American Indians | 0.2 /100 | #259 | Tragic 19.3% |