American vs Canadian Seniors Poverty Over the Age of 65
COMPARE
American
Canadian
Seniors Poverty Over the Age of 65
Seniors Poverty Over the Age of 65 Comparison
Americans
Canadians
10.6%
SENIORS POVERTY OVER THE AGE OF 65
78.1/ 100
METRIC RATING
148th/ 347
METRIC RANK
9.9%
SENIORS POVERTY OVER THE AGE OF 65
98.5/ 100
METRIC RATING
68th/ 347
METRIC RANK
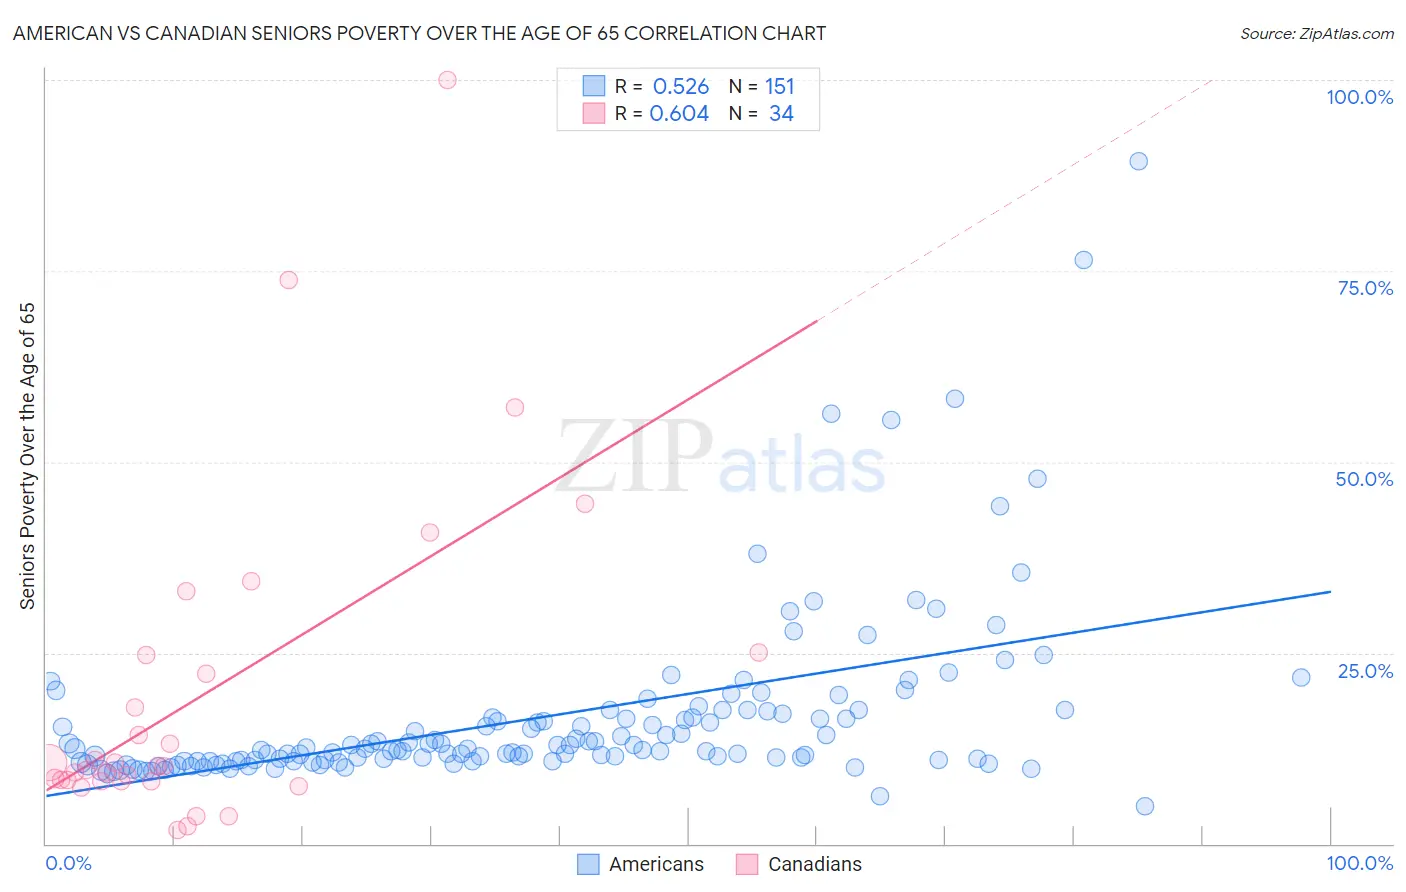
American vs Canadian Seniors Poverty Over the Age of 65 Correlation Chart
The statistical analysis conducted on geographies consisting of 575,593,251 people shows a substantial positive correlation between the proportion of Americans and poverty level among seniors over the age of 65 in the United States with a correlation coefficient (R) of 0.526 and weighted average of 10.6%. Similarly, the statistical analysis conducted on geographies consisting of 435,688,797 people shows a significant positive correlation between the proportion of Canadians and poverty level among seniors over the age of 65 in the United States with a correlation coefficient (R) of 0.604 and weighted average of 9.9%, a difference of 7.1%.
Seniors Poverty Over the Age of 65 Correlation Summary
| Measurement | American | Canadian |
| Minimum | 5.0% | 1.7% |
| Maximum | 89.4% | 100.0% |
| Range | 84.4% | 98.3% |
| Mean | 16.5% | 19.6% |
| Median | 12.4% | 10.2% |
| Interquartile 25% (IQ1) | 10.9% | 8.2% |
| Interquartile 75% (IQ3) | 17.0% | 24.6% |
| Interquartile Range (IQR) | 6.1% | 16.4% |
| Standard Deviation (Sample) | 11.8% | 21.6% |
| Standard Deviation (Population) | 11.7% | 21.3% |
Similar Demographics by Seniors Poverty Over the Age of 65
Demographics Similar to Americans by Seniors Poverty Over the Age of 65
In terms of seniors poverty over the age of 65, the demographic groups most similar to Americans are Immigrants from Cameroon (10.6%, a difference of 0.0%), Immigrants from Switzerland (10.6%, a difference of 0.10%), Immigrants from Greece (10.6%, a difference of 0.13%), Alaskan Athabascan (10.6%, a difference of 0.14%), and Spanish (10.6%, a difference of 0.17%).
| Demographics | Rating | Rank | Seniors Poverty Over the Age of 65 |
| Immigrants | Europe | 83.3 /100 | #141 | Excellent 10.5% |
| Osage | 82.8 /100 | #142 | Excellent 10.6% |
| Immigrants | Asia | 80.8 /100 | #143 | Excellent 10.6% |
| Iraqis | 80.7 /100 | #144 | Excellent 10.6% |
| Laotians | 79.9 /100 | #145 | Good 10.6% |
| Alaskan Athabascans | 79.1 /100 | #146 | Good 10.6% |
| Immigrants | Greece | 79.0 /100 | #147 | Good 10.6% |
| Americans | 78.1 /100 | #148 | Good 10.6% |
| Immigrants | Cameroon | 78.1 /100 | #149 | Good 10.6% |
| Immigrants | Switzerland | 77.3 /100 | #150 | Good 10.6% |
| Spanish | 76.8 /100 | #151 | Good 10.6% |
| Immigrants | Egypt | 76.5 /100 | #152 | Good 10.6% |
| Fijians | 75.6 /100 | #153 | Good 10.7% |
| Immigrants | Saudi Arabia | 74.9 /100 | #154 | Good 10.7% |
| Chickasaw | 73.6 /100 | #155 | Good 10.7% |
Demographics Similar to Canadians by Seniors Poverty Over the Age of 65
In terms of seniors poverty over the age of 65, the demographic groups most similar to Canadians are Australian (9.9%, a difference of 0.16%), Immigrants from Austria (9.9%, a difference of 0.22%), Immigrants from Netherlands (9.9%, a difference of 0.32%), Pennsylvania German (9.9%, a difference of 0.37%), and Immigrants from North America (9.9%, a difference of 0.66%).
| Demographics | Rating | Rank | Seniors Poverty Over the Age of 65 |
| Iranians | 98.9 /100 | #61 | Exceptional 9.8% |
| French Canadians | 98.9 /100 | #62 | Exceptional 9.8% |
| Macedonians | 98.8 /100 | #63 | Exceptional 9.9% |
| Immigrants | North America | 98.8 /100 | #64 | Exceptional 9.9% |
| Pennsylvania Germans | 98.7 /100 | #65 | Exceptional 9.9% |
| Immigrants | Netherlands | 98.7 /100 | #66 | Exceptional 9.9% |
| Immigrants | Austria | 98.6 /100 | #67 | Exceptional 9.9% |
| Canadians | 98.5 /100 | #68 | Exceptional 9.9% |
| Australians | 98.4 /100 | #69 | Exceptional 9.9% |
| Samoans | 98.0 /100 | #70 | Exceptional 10.0% |
| Yugoslavians | 97.9 /100 | #71 | Exceptional 10.0% |
| Palestinians | 97.9 /100 | #72 | Exceptional 10.0% |
| Russians | 97.9 /100 | #73 | Exceptional 10.0% |
| Turks | 97.9 /100 | #74 | Exceptional 10.0% |
| Immigrants | Czechoslovakia | 97.8 /100 | #75 | Exceptional 10.0% |