American vs Immigrants from South America Seniors Poverty Over the Age of 65
COMPARE
American
Immigrants from South America
Seniors Poverty Over the Age of 65
Seniors Poverty Over the Age of 65 Comparison
Americans
Immigrants from South America
10.6%
SENIORS POVERTY OVER THE AGE OF 65
78.1/ 100
METRIC RATING
148th/ 347
METRIC RANK
12.7%
SENIORS POVERTY OVER THE AGE OF 65
0.1/ 100
METRIC RATING
270th/ 347
METRIC RANK
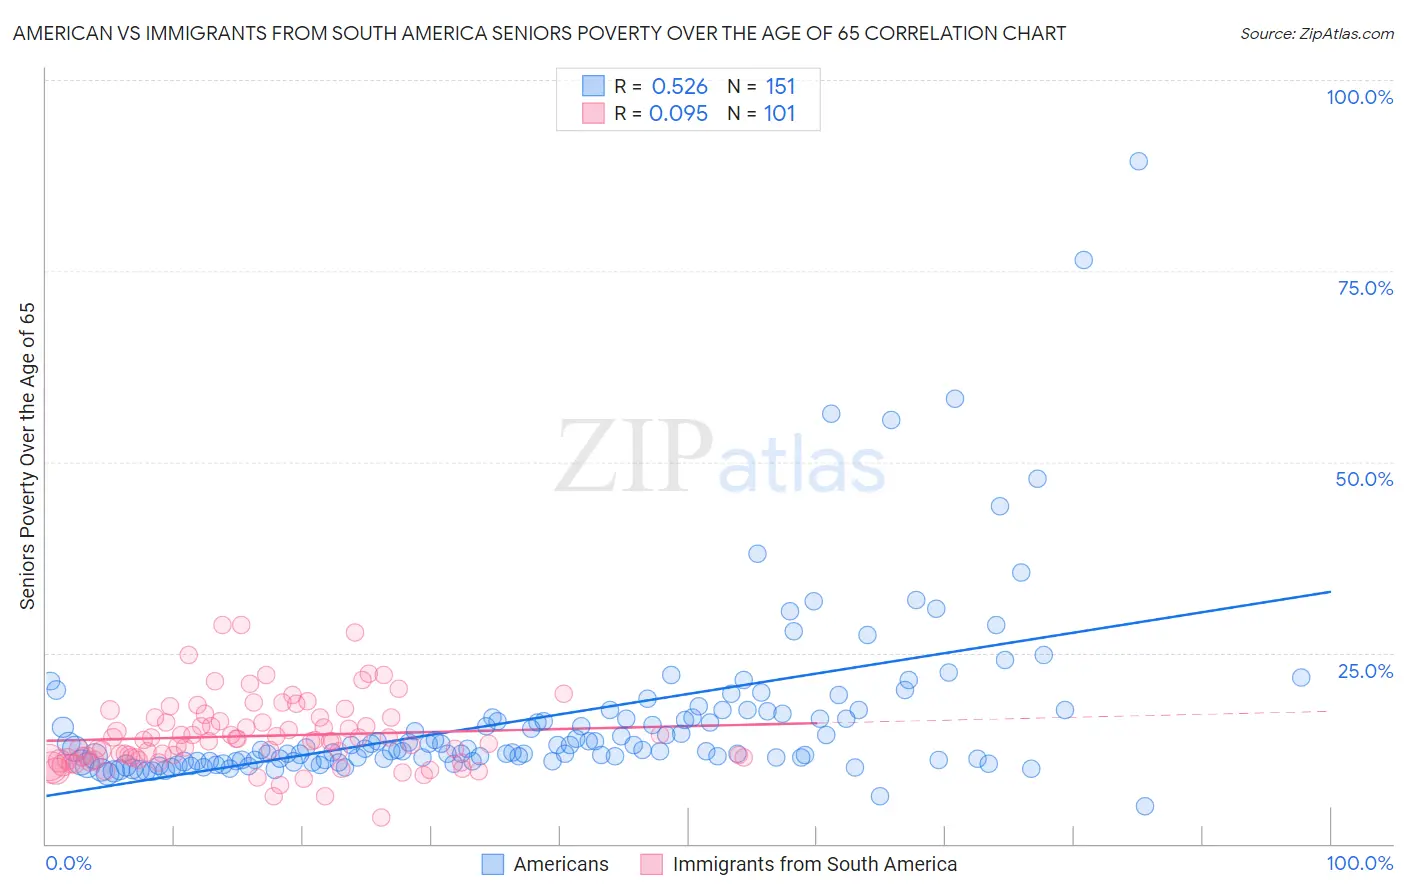
American vs Immigrants from South America Seniors Poverty Over the Age of 65 Correlation Chart
The statistical analysis conducted on geographies consisting of 575,593,251 people shows a substantial positive correlation between the proportion of Americans and poverty level among seniors over the age of 65 in the United States with a correlation coefficient (R) of 0.526 and weighted average of 10.6%. Similarly, the statistical analysis conducted on geographies consisting of 483,863,368 people shows a slight positive correlation between the proportion of Immigrants from South America and poverty level among seniors over the age of 65 in the United States with a correlation coefficient (R) of 0.095 and weighted average of 12.7%, a difference of 19.8%.
Seniors Poverty Over the Age of 65 Correlation Summary
| Measurement | American | Immigrants from South America |
| Minimum | 5.0% | 3.5% |
| Maximum | 89.4% | 28.6% |
| Range | 84.4% | 25.2% |
| Mean | 16.5% | 14.1% |
| Median | 12.4% | 13.5% |
| Interquartile 25% (IQ1) | 10.9% | 11.0% |
| Interquartile 75% (IQ3) | 17.0% | 16.2% |
| Interquartile Range (IQR) | 6.1% | 5.2% |
| Standard Deviation (Sample) | 11.8% | 4.6% |
| Standard Deviation (Population) | 11.7% | 4.6% |
Similar Demographics by Seniors Poverty Over the Age of 65
Demographics Similar to Americans by Seniors Poverty Over the Age of 65
In terms of seniors poverty over the age of 65, the demographic groups most similar to Americans are Immigrants from Cameroon (10.6%, a difference of 0.0%), Immigrants from Switzerland (10.6%, a difference of 0.10%), Immigrants from Greece (10.6%, a difference of 0.13%), Alaskan Athabascan (10.6%, a difference of 0.14%), and Spanish (10.6%, a difference of 0.17%).
| Demographics | Rating | Rank | Seniors Poverty Over the Age of 65 |
| Immigrants | Europe | 83.3 /100 | #141 | Excellent 10.5% |
| Osage | 82.8 /100 | #142 | Excellent 10.6% |
| Immigrants | Asia | 80.8 /100 | #143 | Excellent 10.6% |
| Iraqis | 80.7 /100 | #144 | Excellent 10.6% |
| Laotians | 79.9 /100 | #145 | Good 10.6% |
| Alaskan Athabascans | 79.1 /100 | #146 | Good 10.6% |
| Immigrants | Greece | 79.0 /100 | #147 | Good 10.6% |
| Americans | 78.1 /100 | #148 | Good 10.6% |
| Immigrants | Cameroon | 78.1 /100 | #149 | Good 10.6% |
| Immigrants | Switzerland | 77.3 /100 | #150 | Good 10.6% |
| Spanish | 76.8 /100 | #151 | Good 10.6% |
| Immigrants | Egypt | 76.5 /100 | #152 | Good 10.6% |
| Fijians | 75.6 /100 | #153 | Good 10.7% |
| Immigrants | Saudi Arabia | 74.9 /100 | #154 | Good 10.7% |
| Chickasaw | 73.6 /100 | #155 | Good 10.7% |
Demographics Similar to Immigrants from South America by Seniors Poverty Over the Age of 65
In terms of seniors poverty over the age of 65, the demographic groups most similar to Immigrants from South America are Immigrants from Venezuela (12.7%, a difference of 0.24%), Immigrants from Ghana (12.8%, a difference of 0.27%), Immigrants from Uruguay (12.8%, a difference of 0.30%), Kiowa (12.8%, a difference of 0.42%), and Salvadoran (12.8%, a difference of 0.67%).
| Demographics | Rating | Rank | Seniors Poverty Over the Age of 65 |
| Soviet Union | 0.1 /100 | #263 | Tragic 12.6% |
| Inupiat | 0.1 /100 | #264 | Tragic 12.6% |
| Immigrants | Western Africa | 0.1 /100 | #265 | Tragic 12.6% |
| Africans | 0.1 /100 | #266 | Tragic 12.6% |
| Blackfeet | 0.1 /100 | #267 | Tragic 12.6% |
| Immigrants | Somalia | 0.1 /100 | #268 | Tragic 12.6% |
| Immigrants | Venezuela | 0.1 /100 | #269 | Tragic 12.7% |
| Immigrants | South America | 0.1 /100 | #270 | Tragic 12.7% |
| Immigrants | Ghana | 0.1 /100 | #271 | Tragic 12.8% |
| Immigrants | Uruguay | 0.1 /100 | #272 | Tragic 12.8% |
| Kiowa | 0.0 /100 | #273 | Tragic 12.8% |
| Salvadorans | 0.0 /100 | #274 | Tragic 12.8% |
| Immigrants | Colombia | 0.0 /100 | #275 | Tragic 12.9% |
| Immigrants | Azores | 0.0 /100 | #276 | Tragic 12.9% |
| Paiute | 0.0 /100 | #277 | Tragic 12.9% |