Alsatian vs Yugoslavian Single Mother Poverty
COMPARE
Alsatian
Yugoslavian
Single Mother Poverty
Single Mother Poverty Comparison
Alsatians
Yugoslavians
34.3%
SINGLE MOTHER POVERTY
0.0/ 100
METRIC RATING
311th/ 347
METRIC RANK
29.4%
SINGLE MOTHER POVERTY
36.0/ 100
METRIC RATING
186th/ 347
METRIC RANK
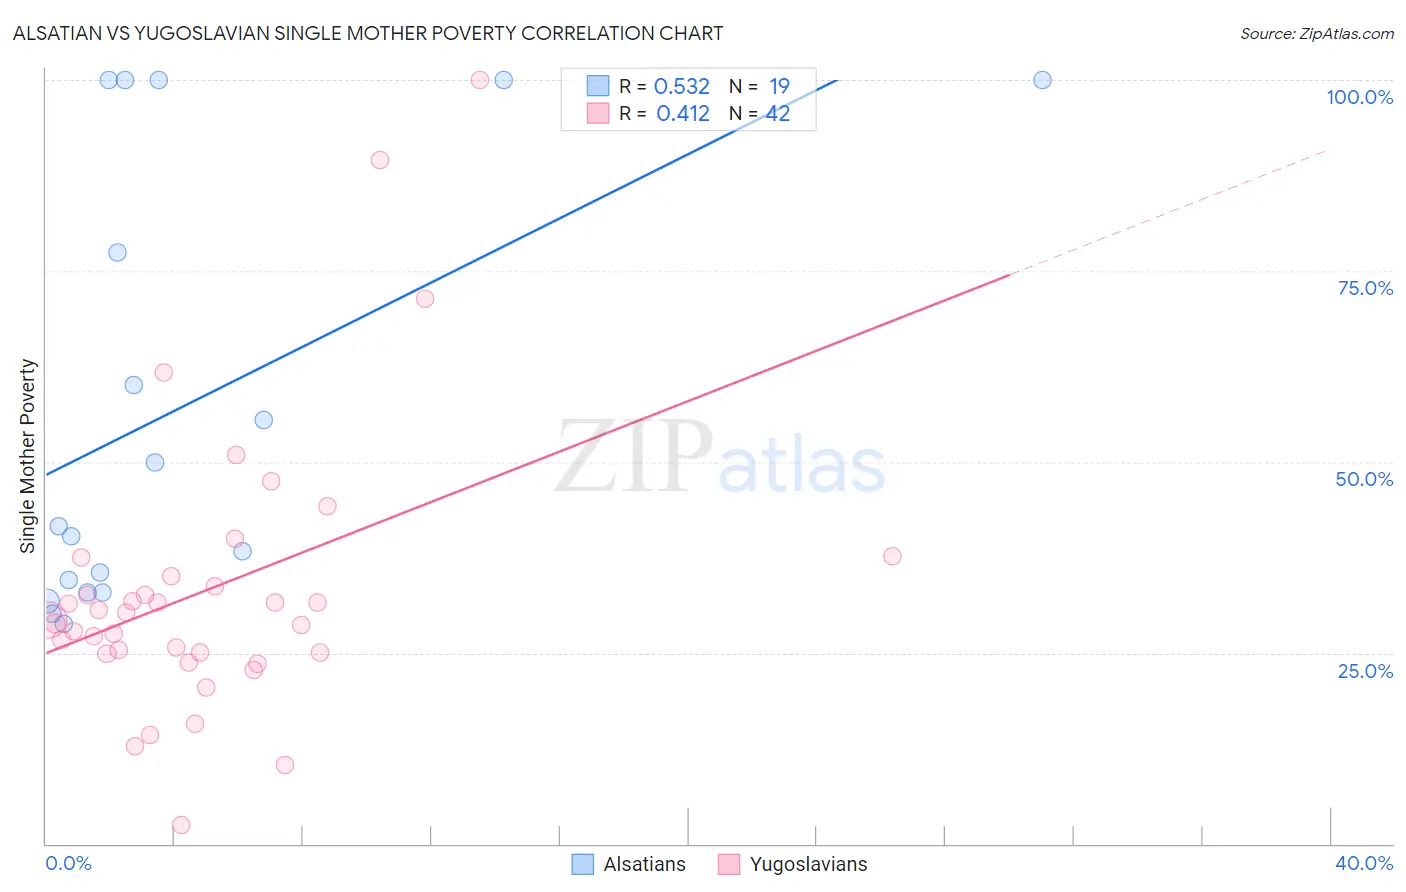
Alsatian vs Yugoslavian Single Mother Poverty Correlation Chart
The statistical analysis conducted on geographies consisting of 81,863,686 people shows a substantial positive correlation between the proportion of Alsatians and poverty level among single mothers in the United States with a correlation coefficient (R) of 0.532 and weighted average of 34.3%. Similarly, the statistical analysis conducted on geographies consisting of 280,794,338 people shows a moderate positive correlation between the proportion of Yugoslavians and poverty level among single mothers in the United States with a correlation coefficient (R) of 0.412 and weighted average of 29.4%, a difference of 16.8%.
Single Mother Poverty Correlation Summary
| Measurement | Alsatian | Yugoslavian |
| Minimum | 28.9% | 2.5% |
| Maximum | 100.0% | 100.0% |
| Range | 71.1% | 97.5% |
| Mean | 57.3% | 33.4% |
| Median | 41.5% | 29.7% |
| Interquartile 25% (IQ1) | 32.9% | 25.0% |
| Interquartile 75% (IQ3) | 100.0% | 35.0% |
| Interquartile Range (IQR) | 67.1% | 10.0% |
| Standard Deviation (Sample) | 28.7% | 18.6% |
| Standard Deviation (Population) | 28.0% | 18.4% |
Similar Demographics by Single Mother Poverty
Demographics Similar to Alsatians by Single Mother Poverty
In terms of single mother poverty, the demographic groups most similar to Alsatians are Central American Indian (34.3%, a difference of 0.080%), Immigrants from Dominican Republic (34.4%, a difference of 0.16%), Honduran (34.2%, a difference of 0.31%), Chickasaw (34.4%, a difference of 0.33%), and Hopi (34.5%, a difference of 0.41%).
| Demographics | Rating | Rank | Single Mother Poverty |
| Mexicans | 0.0 /100 | #304 | Tragic 33.6% |
| Immigrants | Central America | 0.0 /100 | #305 | Tragic 33.6% |
| Immigrants | Congo | 0.0 /100 | #306 | Tragic 33.8% |
| Comanche | 0.0 /100 | #307 | Tragic 33.9% |
| Immigrants | Mexico | 0.0 /100 | #308 | Tragic 34.0% |
| Potawatomi | 0.0 /100 | #309 | Tragic 34.1% |
| Hondurans | 0.0 /100 | #310 | Tragic 34.2% |
| Alsatians | 0.0 /100 | #311 | Tragic 34.3% |
| Central American Indians | 0.0 /100 | #312 | Tragic 34.3% |
| Immigrants | Dominican Republic | 0.0 /100 | #313 | Tragic 34.4% |
| Chickasaw | 0.0 /100 | #314 | Tragic 34.4% |
| Hopi | 0.0 /100 | #315 | Tragic 34.5% |
| Dominicans | 0.0 /100 | #316 | Tragic 34.5% |
| Cherokee | 0.0 /100 | #317 | Tragic 34.5% |
| Immigrants | Honduras | 0.0 /100 | #318 | Tragic 34.7% |
Demographics Similar to Yugoslavians by Single Mother Poverty
In terms of single mother poverty, the demographic groups most similar to Yugoslavians are Ghanaian (29.4%, a difference of 0.040%), Nigerian (29.3%, a difference of 0.10%), Nepalese (29.3%, a difference of 0.11%), Immigrants from Eastern Africa (29.3%, a difference of 0.13%), and Lebanese (29.4%, a difference of 0.19%).
| Demographics | Rating | Rank | Single Mother Poverty |
| Immigrants | Uzbekistan | 42.6 /100 | #179 | Average 29.3% |
| Immigrants | Norway | 41.5 /100 | #180 | Average 29.3% |
| Canadians | 40.4 /100 | #181 | Average 29.3% |
| Immigrants | Eastern Africa | 38.5 /100 | #182 | Fair 29.3% |
| Nepalese | 38.3 /100 | #183 | Fair 29.3% |
| Nigerians | 38.0 /100 | #184 | Fair 29.3% |
| Ghanaians | 36.8 /100 | #185 | Fair 29.4% |
| Yugoslavians | 36.0 /100 | #186 | Fair 29.4% |
| Lebanese | 32.5 /100 | #187 | Fair 29.4% |
| Guamanians/Chamorros | 31.8 /100 | #188 | Fair 29.4% |
| Immigrants | Africa | 31.6 /100 | #189 | Fair 29.4% |
| Immigrants | Germany | 30.4 /100 | #190 | Fair 29.5% |
| Immigrants | Trinidad and Tobago | 29.2 /100 | #191 | Fair 29.5% |
| Moroccans | 28.6 /100 | #192 | Fair 29.5% |
| Basques | 28.3 /100 | #193 | Fair 29.5% |