Alsatian vs Yugoslavian Unemployment Among Seniors over 75 years
COMPARE
Alsatian
Yugoslavian
Unemployment Among Seniors over 75 years
Unemployment Among Seniors over 75 years Comparison
Alsatians
Yugoslavians
6.1%
UNEMPLOYMENT AMONG SENIORS OVER 75 YEARS
100.0/ 100
METRIC RATING
4th/ 347
METRIC RANK
9.1%
UNEMPLOYMENT AMONG SENIORS OVER 75 YEARS
4.8/ 100
METRIC RATING
233rd/ 347
METRIC RANK
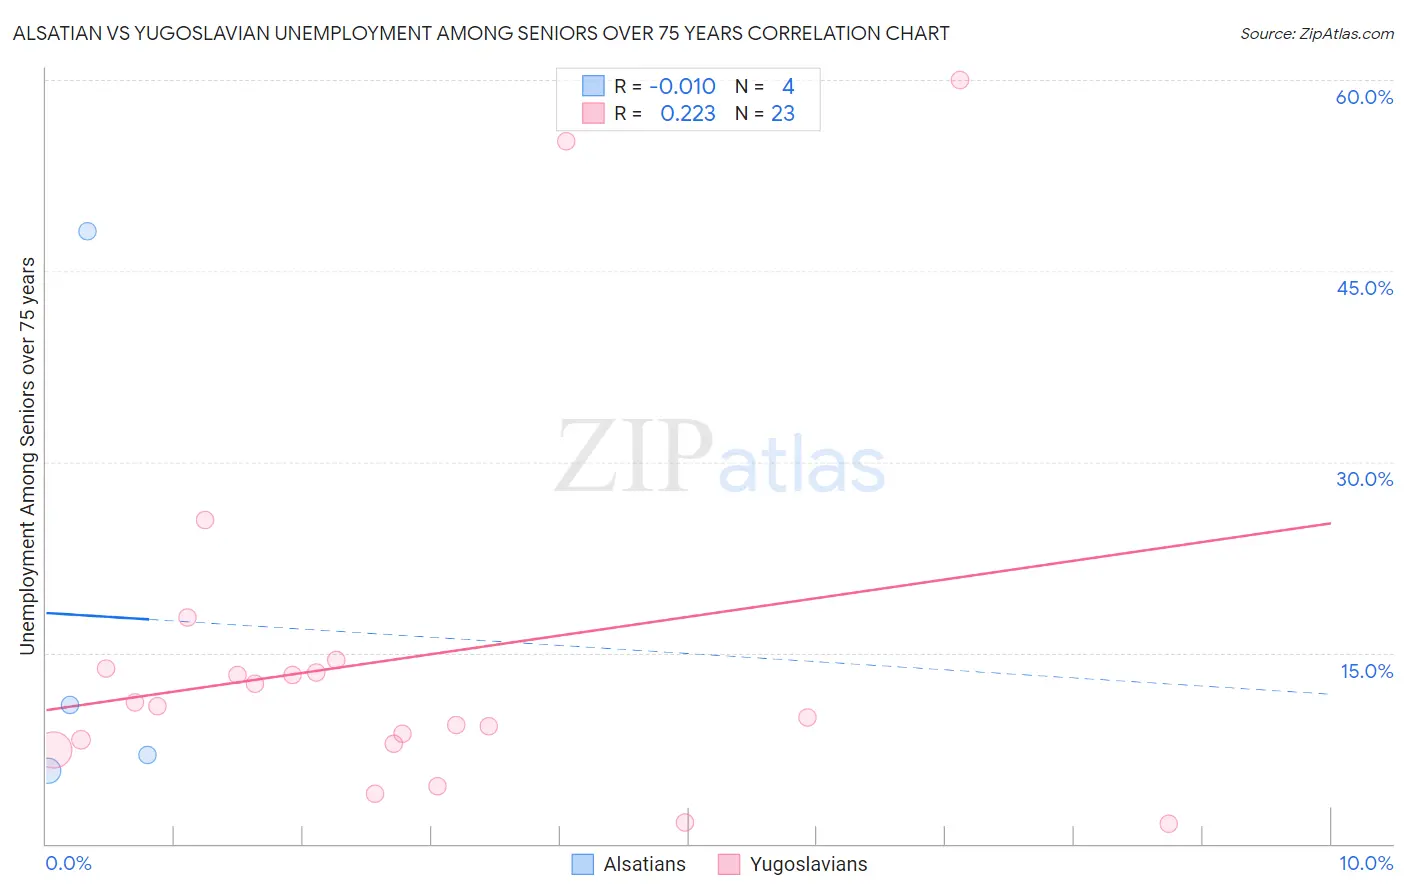
Alsatian vs Yugoslavian Unemployment Among Seniors over 75 years Correlation Chart
The statistical analysis conducted on geographies consisting of 64,928,583 people shows no correlation between the proportion of Alsatians and unemployment rate among seniors over the age of 75 in the United States with a correlation coefficient (R) of -0.010 and weighted average of 6.1%. Similarly, the statistical analysis conducted on geographies consisting of 163,293,100 people shows a weak positive correlation between the proportion of Yugoslavians and unemployment rate among seniors over the age of 75 in the United States with a correlation coefficient (R) of 0.223 and weighted average of 9.1%, a difference of 48.7%.
Unemployment Among Seniors over 75 years Correlation Summary
| Measurement | Alsatian | Yugoslavian |
| Minimum | 5.7% | 1.6% |
| Maximum | 48.1% | 60.0% |
| Range | 42.4% | 58.4% |
| Mean | 17.9% | 14.5% |
| Median | 8.9% | 10.8% |
| Interquartile 25% (IQ1) | 6.4% | 7.8% |
| Interquartile 75% (IQ3) | 29.5% | 13.8% |
| Interquartile Range (IQR) | 23.1% | 5.9% |
| Standard Deviation (Sample) | 20.2% | 14.6% |
| Standard Deviation (Population) | 17.5% | 14.3% |
Similar Demographics by Unemployment Among Seniors over 75 years
Demographics Similar to Alsatians by Unemployment Among Seniors over 75 years
In terms of unemployment among seniors over 75 years, the demographic groups most similar to Alsatians are Hopi (6.3%, a difference of 2.6%), Cheyenne (5.9%, a difference of 2.9%), Chinese (5.9%, a difference of 3.5%), Crow (5.9%, a difference of 3.5%), and Immigrants from Armenia (6.5%, a difference of 6.5%).
| Demographics | Rating | Rank | Unemployment Among Seniors over 75 years |
| Crow | 100.0 /100 | #1 | Exceptional 5.9% |
| Chinese | 100.0 /100 | #2 | Exceptional 5.9% |
| Cheyenne | 100.0 /100 | #3 | Exceptional 5.9% |
| Alsatians | 100.0 /100 | #4 | Exceptional 6.1% |
| Hopi | 100.0 /100 | #5 | Exceptional 6.3% |
| Immigrants | Armenia | 100.0 /100 | #6 | Exceptional 6.5% |
| Spanish American Indians | 100.0 /100 | #7 | Exceptional 6.5% |
| Taiwanese | 100.0 /100 | #8 | Exceptional 6.6% |
| Soviet Union | 100.0 /100 | #9 | Exceptional 6.6% |
| Yuman | 100.0 /100 | #10 | Exceptional 6.7% |
| Immigrants | Grenada | 100.0 /100 | #11 | Exceptional 6.7% |
| Comanche | 100.0 /100 | #12 | Exceptional 6.7% |
| Immigrants | Congo | 100.0 /100 | #13 | Exceptional 6.7% |
| Ute | 100.0 /100 | #14 | Exceptional 6.8% |
| Icelanders | 100.0 /100 | #15 | Exceptional 7.0% |
Demographics Similar to Yugoslavians by Unemployment Among Seniors over 75 years
In terms of unemployment among seniors over 75 years, the demographic groups most similar to Yugoslavians are African (9.1%, a difference of 0.020%), Northern European (9.1%, a difference of 0.040%), Immigrants from Central America (9.1%, a difference of 0.040%), Hispanic or Latino (9.1%, a difference of 0.050%), and Vietnamese (9.1%, a difference of 0.050%).
| Demographics | Rating | Rank | Unemployment Among Seniors over 75 years |
| Immigrants | Bangladesh | 5.9 /100 | #226 | Tragic 9.1% |
| Samoans | 5.7 /100 | #227 | Tragic 9.1% |
| Kenyans | 5.4 /100 | #228 | Tragic 9.1% |
| Hispanics or Latinos | 5.0 /100 | #229 | Tragic 9.1% |
| Northern Europeans | 4.9 /100 | #230 | Tragic 9.1% |
| Immigrants | Central America | 4.9 /100 | #231 | Tragic 9.1% |
| Africans | 4.9 /100 | #232 | Tragic 9.1% |
| Yugoslavians | 4.8 /100 | #233 | Tragic 9.1% |
| Vietnamese | 4.6 /100 | #234 | Tragic 9.1% |
| Panamanians | 4.0 /100 | #235 | Tragic 9.1% |
| Jordanians | 4.0 /100 | #236 | Tragic 9.1% |
| Houma | 3.9 /100 | #237 | Tragic 9.1% |
| Inupiat | 3.6 /100 | #238 | Tragic 9.1% |
| Mexicans | 3.5 /100 | #239 | Tragic 9.1% |
| Spanish | 3.3 /100 | #240 | Tragic 9.1% |