Uruguayan vs Yugoslavian Single Mother Poverty
COMPARE
Uruguayan
Yugoslavian
Single Mother Poverty
Single Mother Poverty Comparison
Uruguayans
Yugoslavians
28.3%
SINGLE MOTHER POVERTY
91.7/ 100
METRIC RATING
123rd/ 347
METRIC RANK
29.4%
SINGLE MOTHER POVERTY
36.0/ 100
METRIC RATING
186th/ 347
METRIC RANK
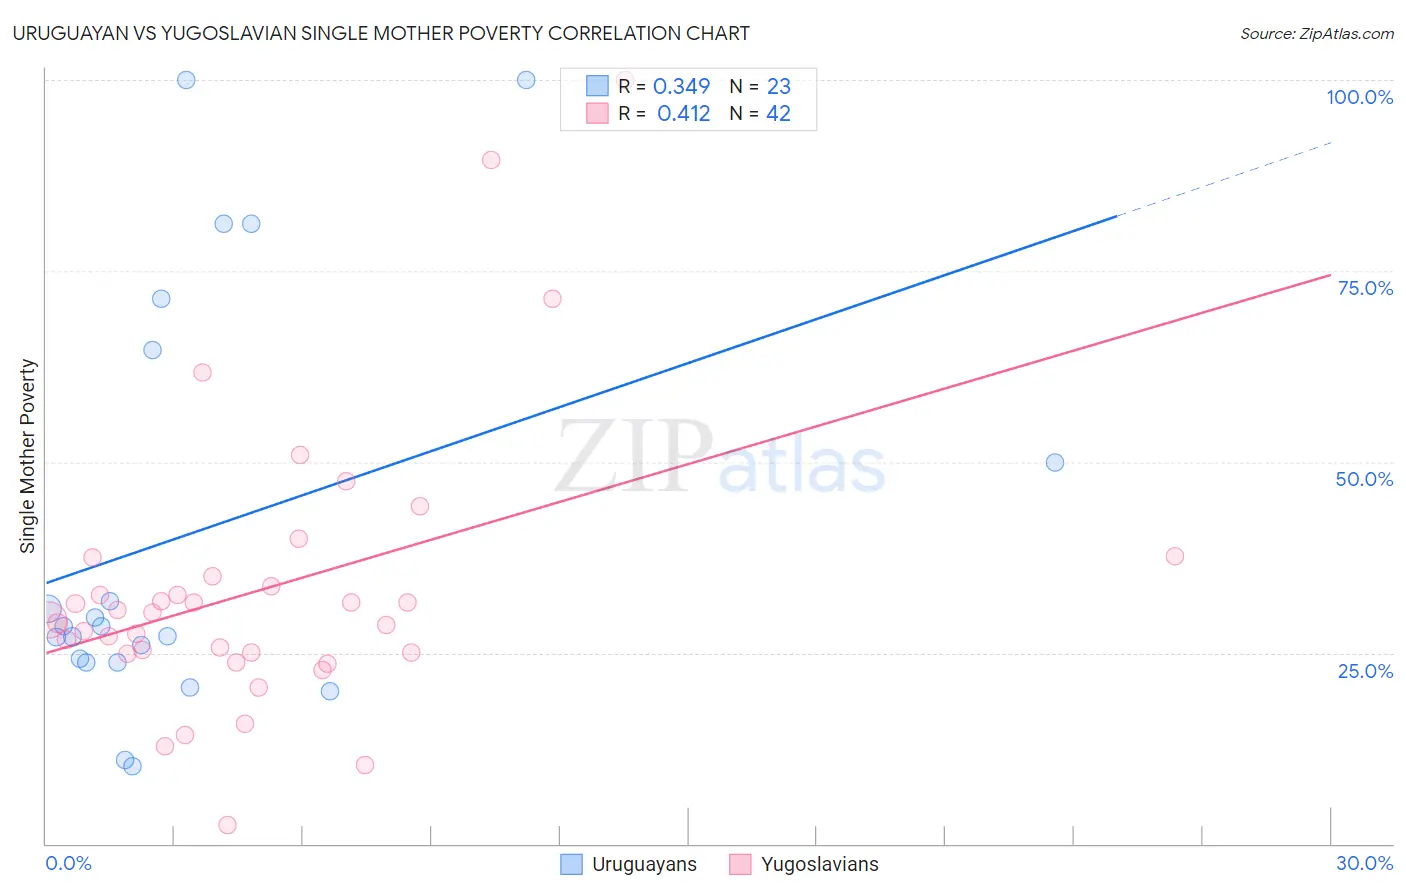
Uruguayan vs Yugoslavian Single Mother Poverty Correlation Chart
The statistical analysis conducted on geographies consisting of 142,981,701 people shows a mild positive correlation between the proportion of Uruguayans and poverty level among single mothers in the United States with a correlation coefficient (R) of 0.349 and weighted average of 28.3%. Similarly, the statistical analysis conducted on geographies consisting of 280,794,338 people shows a moderate positive correlation between the proportion of Yugoslavians and poverty level among single mothers in the United States with a correlation coefficient (R) of 0.412 and weighted average of 29.4%, a difference of 3.7%.
Single Mother Poverty Correlation Summary
| Measurement | Uruguayan | Yugoslavian |
| Minimum | 10.2% | 2.5% |
| Maximum | 100.0% | 100.0% |
| Range | 89.8% | 97.5% |
| Mean | 40.8% | 33.4% |
| Median | 28.4% | 29.7% |
| Interquartile 25% (IQ1) | 23.7% | 25.0% |
| Interquartile 75% (IQ3) | 64.7% | 35.0% |
| Interquartile Range (IQR) | 40.9% | 10.0% |
| Standard Deviation (Sample) | 27.6% | 18.6% |
| Standard Deviation (Population) | 27.0% | 18.4% |
Similar Demographics by Single Mother Poverty
Demographics Similar to Uruguayans by Single Mother Poverty
In terms of single mother poverty, the demographic groups most similar to Uruguayans are Immigrants from Switzerland (28.3%, a difference of 0.0%), Colombian (28.3%, a difference of 0.010%), Immigrants from Afghanistan (28.3%, a difference of 0.060%), Cypriot (28.3%, a difference of 0.10%), and Immigrants from Syria (28.3%, a difference of 0.11%).
| Demographics | Rating | Rank | Single Mother Poverty |
| Immigrants | Uganda | 92.5 /100 | #116 | Exceptional 28.3% |
| Australians | 92.5 /100 | #117 | Exceptional 28.3% |
| Brazilians | 92.4 /100 | #118 | Exceptional 28.3% |
| Immigrants | Syria | 92.4 /100 | #119 | Exceptional 28.3% |
| Cypriots | 92.3 /100 | #120 | Exceptional 28.3% |
| Immigrants | Afghanistan | 92.1 /100 | #121 | Exceptional 28.3% |
| Colombians | 91.8 /100 | #122 | Exceptional 28.3% |
| Uruguayans | 91.7 /100 | #123 | Exceptional 28.3% |
| Immigrants | Switzerland | 91.7 /100 | #124 | Exceptional 28.3% |
| Kenyans | 90.9 /100 | #125 | Exceptional 28.4% |
| Immigrants | Chile | 90.8 /100 | #126 | Exceptional 28.4% |
| Poles | 90.8 /100 | #127 | Exceptional 28.4% |
| Immigrants | England | 90.5 /100 | #128 | Exceptional 28.4% |
| South Americans | 90.4 /100 | #129 | Exceptional 28.4% |
| Norwegians | 90.4 /100 | #130 | Exceptional 28.4% |
Demographics Similar to Yugoslavians by Single Mother Poverty
In terms of single mother poverty, the demographic groups most similar to Yugoslavians are Ghanaian (29.4%, a difference of 0.040%), Nigerian (29.3%, a difference of 0.10%), Nepalese (29.3%, a difference of 0.11%), Immigrants from Eastern Africa (29.3%, a difference of 0.13%), and Lebanese (29.4%, a difference of 0.19%).
| Demographics | Rating | Rank | Single Mother Poverty |
| Immigrants | Uzbekistan | 42.6 /100 | #179 | Average 29.3% |
| Immigrants | Norway | 41.5 /100 | #180 | Average 29.3% |
| Canadians | 40.4 /100 | #181 | Average 29.3% |
| Immigrants | Eastern Africa | 38.5 /100 | #182 | Fair 29.3% |
| Nepalese | 38.3 /100 | #183 | Fair 29.3% |
| Nigerians | 38.0 /100 | #184 | Fair 29.3% |
| Ghanaians | 36.8 /100 | #185 | Fair 29.4% |
| Yugoslavians | 36.0 /100 | #186 | Fair 29.4% |
| Lebanese | 32.5 /100 | #187 | Fair 29.4% |
| Guamanians/Chamorros | 31.8 /100 | #188 | Fair 29.4% |
| Immigrants | Africa | 31.6 /100 | #189 | Fair 29.4% |
| Immigrants | Germany | 30.4 /100 | #190 | Fair 29.5% |
| Immigrants | Trinidad and Tobago | 29.2 /100 | #191 | Fair 29.5% |
| Moroccans | 28.6 /100 | #192 | Fair 29.5% |
| Basques | 28.3 /100 | #193 | Fair 29.5% |