Immigrants from Kenya vs Subsaharan African Single Female Poverty
COMPARE
Immigrants from Kenya
Subsaharan African
Single Female Poverty
Single Female Poverty Comparison
Immigrants from Kenya
Sub-Saharan Africans
21.4%
SINGLE FEMALE POVERTY
20.7/ 100
METRIC RATING
202nd/ 347
METRIC RANK
23.2%
SINGLE FEMALE POVERTY
0.1/ 100
METRIC RATING
271st/ 347
METRIC RANK
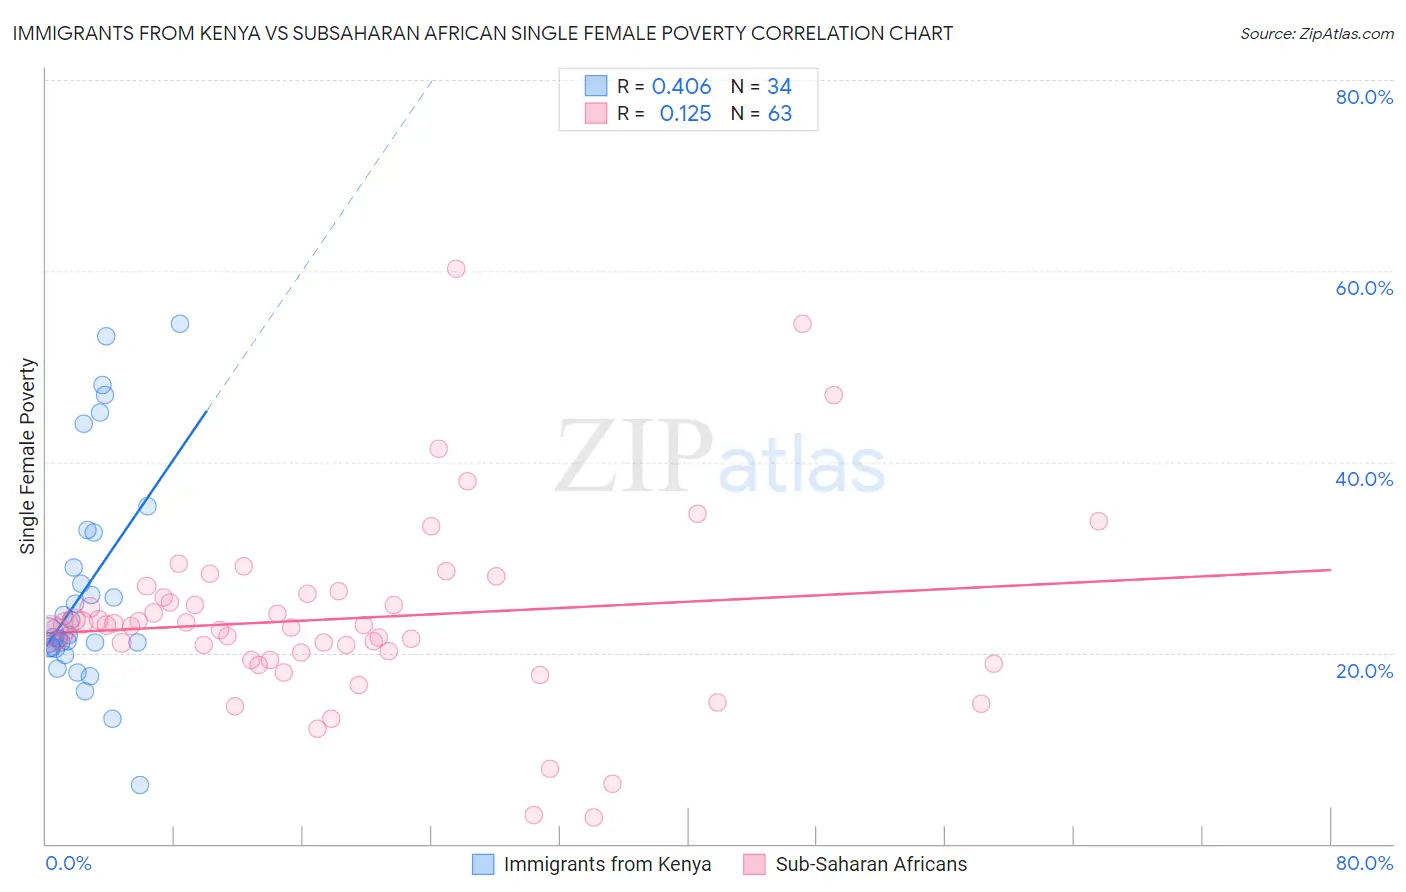
Immigrants from Kenya vs Subsaharan African Single Female Poverty Correlation Chart
The statistical analysis conducted on geographies consisting of 216,607,020 people shows a moderate positive correlation between the proportion of Immigrants from Kenya and poverty level among single females in the United States with a correlation coefficient (R) of 0.406 and weighted average of 21.4%. Similarly, the statistical analysis conducted on geographies consisting of 498,393,739 people shows a poor positive correlation between the proportion of Sub-Saharan Africans and poverty level among single females in the United States with a correlation coefficient (R) of 0.125 and weighted average of 23.2%, a difference of 8.1%.
Single Female Poverty Correlation Summary
| Measurement | Immigrants from Kenya | Subsaharan African |
| Minimum | 6.1% | 2.8% |
| Maximum | 54.5% | 60.3% |
| Range | 48.4% | 57.5% |
| Mean | 26.9% | 23.6% |
| Median | 21.8% | 22.9% |
| Interquartile 25% (IQ1) | 20.5% | 19.3% |
| Interquartile 75% (IQ3) | 32.6% | 26.2% |
| Interquartile Range (IQR) | 12.0% | 6.9% |
| Standard Deviation (Sample) | 11.7% | 9.9% |
| Standard Deviation (Population) | 11.5% | 9.8% |
Similar Demographics by Single Female Poverty
Demographics Similar to Immigrants from Kenya by Single Female Poverty
In terms of single female poverty, the demographic groups most similar to Immigrants from Kenya are Nigerian (21.4%, a difference of 0.020%), Irish (21.4%, a difference of 0.070%), Immigrants (21.4%, a difference of 0.12%), Immigrants from Haiti (21.5%, a difference of 0.18%), and Swiss (21.4%, a difference of 0.31%).
| Demographics | Rating | Rank | Single Female Poverty |
| Nicaraguans | 27.6 /100 | #195 | Fair 21.3% |
| Immigrants | Saudi Arabia | 27.1 /100 | #196 | Fair 21.3% |
| Japanese | 26.4 /100 | #197 | Fair 21.3% |
| Swiss | 24.2 /100 | #198 | Fair 21.4% |
| Immigrants | Immigrants | 22.0 /100 | #199 | Fair 21.4% |
| Irish | 21.4 /100 | #200 | Fair 21.4% |
| Nigerians | 20.9 /100 | #201 | Fair 21.4% |
| Immigrants | Kenya | 20.7 /100 | #202 | Fair 21.4% |
| Immigrants | Haiti | 18.8 /100 | #203 | Poor 21.5% |
| Immigrants | Africa | 16.7 /100 | #204 | Poor 21.5% |
| Finns | 16.2 /100 | #205 | Poor 21.5% |
| Belgians | 16.1 /100 | #206 | Poor 21.5% |
| Ghanaians | 15.7 /100 | #207 | Poor 21.6% |
| Haitians | 15.4 /100 | #208 | Poor 21.6% |
| Immigrants | Eastern Africa | 15.1 /100 | #209 | Poor 21.6% |
Demographics Similar to Sub-Saharan Africans by Single Female Poverty
In terms of single female poverty, the demographic groups most similar to Sub-Saharan Africans are Immigrants from Senegal (23.2%, a difference of 0.19%), Inupiat (23.1%, a difference of 0.25%), Alaska Native (23.3%, a difference of 0.44%), Marshallese (23.3%, a difference of 0.45%), and Hmong (23.1%, a difference of 0.50%).
| Demographics | Rating | Rank | Single Female Poverty |
| Immigrants | Laos | 0.3 /100 | #264 | Tragic 22.9% |
| Central Americans | 0.2 /100 | #265 | Tragic 23.0% |
| Immigrants | Micronesia | 0.2 /100 | #266 | Tragic 23.0% |
| Senegalese | 0.2 /100 | #267 | Tragic 23.0% |
| Fijians | 0.2 /100 | #268 | Tragic 23.1% |
| Hmong | 0.2 /100 | #269 | Tragic 23.1% |
| Inupiat | 0.2 /100 | #270 | Tragic 23.1% |
| Sub-Saharan Africans | 0.1 /100 | #271 | Tragic 23.2% |
| Immigrants | Senegal | 0.1 /100 | #272 | Tragic 23.2% |
| Alaska Natives | 0.1 /100 | #273 | Tragic 23.3% |
| Marshallese | 0.1 /100 | #274 | Tragic 23.3% |
| Mexican American Indians | 0.1 /100 | #275 | Tragic 23.4% |
| Immigrants | Azores | 0.0 /100 | #276 | Tragic 23.5% |
| Pennsylvania Germans | 0.0 /100 | #277 | Tragic 23.6% |
| Immigrants | Nonimmigrants | 0.0 /100 | #278 | Tragic 23.6% |