African vs Luxembourger Female Poverty
COMPARE
African
Luxembourger
Female Poverty
Female Poverty Comparison
Africans
Luxembourgers
16.9%
FEMALE POVERTY
0.0/ 100
METRIC RATING
308th/ 347
METRIC RANK
11.6%
FEMALE POVERTY
99.7/ 100
METRIC RATING
24th/ 347
METRIC RANK
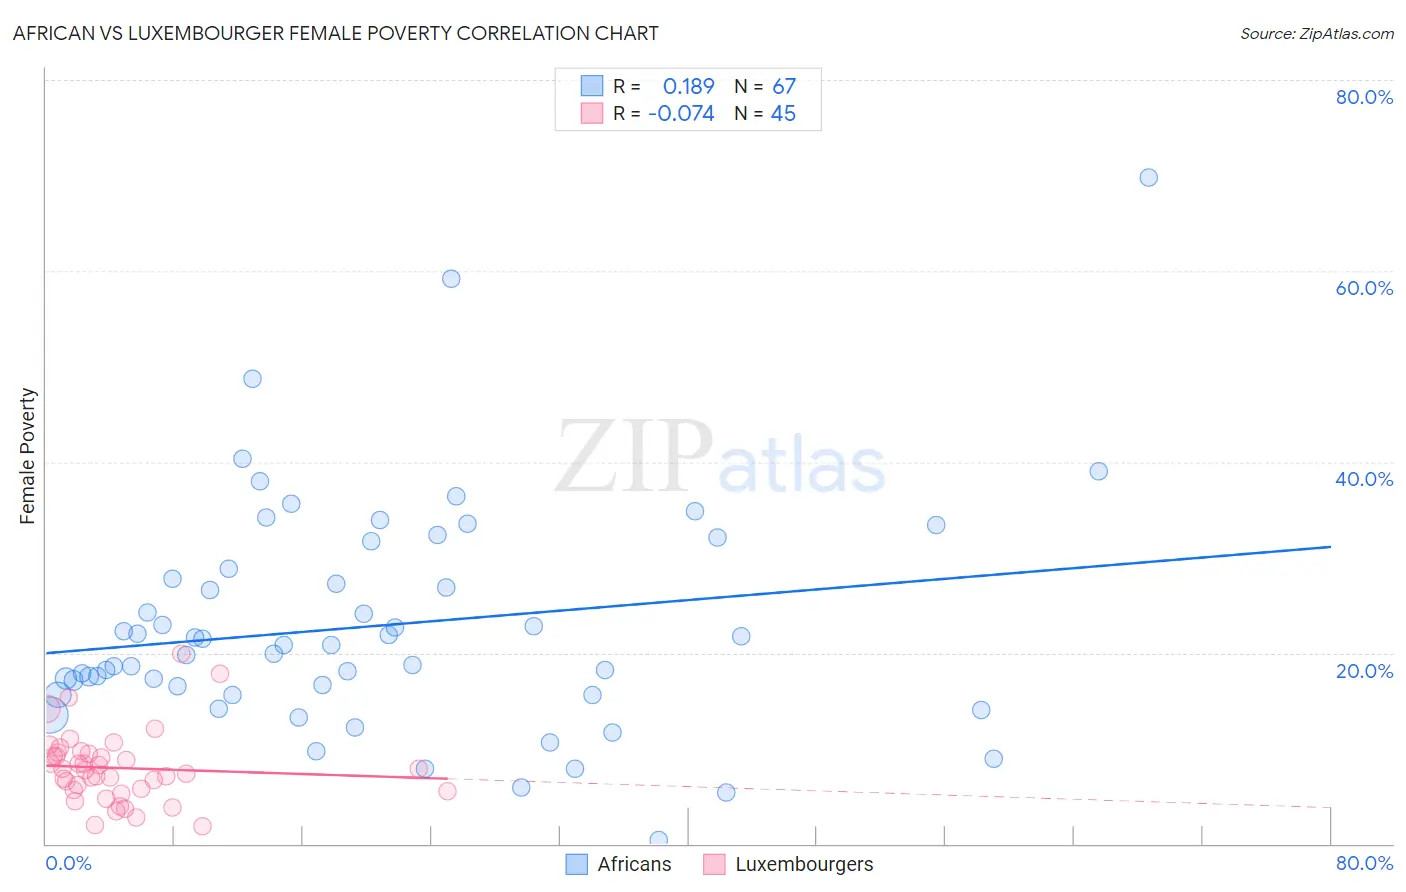
African vs Luxembourger Female Poverty Correlation Chart
The statistical analysis conducted on geographies consisting of 469,508,235 people shows a poor positive correlation between the proportion of Africans and poverty level among females in the United States with a correlation coefficient (R) of 0.189 and weighted average of 16.9%. Similarly, the statistical analysis conducted on geographies consisting of 144,645,818 people shows a slight negative correlation between the proportion of Luxembourgers and poverty level among females in the United States with a correlation coefficient (R) of -0.074 and weighted average of 11.6%, a difference of 45.6%.
Female Poverty Correlation Summary
| Measurement | African | Luxembourger |
| Minimum | 0.38% | 1.8% |
| Maximum | 69.8% | 19.8% |
| Range | 69.4% | 18.1% |
| Mean | 22.8% | 7.9% |
| Median | 20.8% | 7.7% |
| Interquartile 25% (IQ1) | 15.6% | 5.5% |
| Interquartile 75% (IQ3) | 28.8% | 9.5% |
| Interquartile Range (IQR) | 13.2% | 4.0% |
| Standard Deviation (Sample) | 12.0% | 3.8% |
| Standard Deviation (Population) | 11.9% | 3.7% |
Similar Demographics by Female Poverty
Demographics Similar to Africans by Female Poverty
In terms of female poverty, the demographic groups most similar to Africans are Seminole (16.9%, a difference of 0.060%), Immigrants from Caribbean (16.9%, a difference of 0.19%), Immigrants from Mexico (17.0%, a difference of 0.39%), Immigrants from Grenada (16.8%, a difference of 0.45%), and Immigrants from Central America (16.8%, a difference of 0.46%).
| Demographics | Rating | Rank | Female Poverty |
| Guatemalans | 0.0 /100 | #301 | Tragic 16.7% |
| Chippewa | 0.0 /100 | #302 | Tragic 16.7% |
| Choctaw | 0.0 /100 | #303 | Tragic 16.8% |
| Immigrants | Central America | 0.0 /100 | #304 | Tragic 16.8% |
| Immigrants | Grenada | 0.0 /100 | #305 | Tragic 16.8% |
| Immigrants | Caribbean | 0.0 /100 | #306 | Tragic 16.9% |
| Seminole | 0.0 /100 | #307 | Tragic 16.9% |
| Africans | 0.0 /100 | #308 | Tragic 16.9% |
| Immigrants | Mexico | 0.0 /100 | #309 | Tragic 17.0% |
| Creek | 0.0 /100 | #310 | Tragic 17.0% |
| Immigrants | Guatemala | 0.0 /100 | #311 | Tragic 17.0% |
| Immigrants | Somalia | 0.0 /100 | #312 | Tragic 17.0% |
| British West Indians | 0.0 /100 | #313 | Tragic 17.0% |
| Dutch West Indians | 0.0 /100 | #314 | Tragic 17.1% |
| U.S. Virgin Islanders | 0.0 /100 | #315 | Tragic 17.3% |
Demographics Similar to Luxembourgers by Female Poverty
In terms of female poverty, the demographic groups most similar to Luxembourgers are Burmese (11.6%, a difference of 0.020%), Swedish (11.6%, a difference of 0.16%), Italian (11.6%, a difference of 0.19%), Immigrants from Northern Europe (11.6%, a difference of 0.26%), and Croatian (11.6%, a difference of 0.27%).
| Demographics | Rating | Rank | Female Poverty |
| Bolivians | 99.8 /100 | #17 | Exceptional 11.5% |
| Immigrants | Scotland | 99.8 /100 | #18 | Exceptional 11.5% |
| Norwegians | 99.8 /100 | #19 | Exceptional 11.5% |
| Eastern Europeans | 99.7 /100 | #20 | Exceptional 11.5% |
| Italians | 99.7 /100 | #21 | Exceptional 11.6% |
| Swedes | 99.7 /100 | #22 | Exceptional 11.6% |
| Burmese | 99.7 /100 | #23 | Exceptional 11.6% |
| Luxembourgers | 99.7 /100 | #24 | Exceptional 11.6% |
| Immigrants | Northern Europe | 99.6 /100 | #25 | Exceptional 11.6% |
| Croatians | 99.6 /100 | #26 | Exceptional 11.6% |
| Iranians | 99.6 /100 | #27 | Exceptional 11.7% |
| Immigrants | Korea | 99.6 /100 | #28 | Exceptional 11.7% |
| Immigrants | North Macedonia | 99.6 /100 | #29 | Exceptional 11.7% |
| Greeks | 99.5 /100 | #30 | Exceptional 11.7% |
| Poles | 99.5 /100 | #31 | Exceptional 11.7% |