African vs Luxembourger Single Mother Households
COMPARE
African
Luxembourger
Single Mother Households
Single Mother Households Comparison
Africans
Luxembourgers
8.2%
SINGLE MOTHER HOUSEHOLDS
0.0/ 100
METRIC RATING
316th/ 347
METRIC RANK
5.6%
SINGLE MOTHER HOUSEHOLDS
98.7/ 100
METRIC RATING
59th/ 347
METRIC RANK
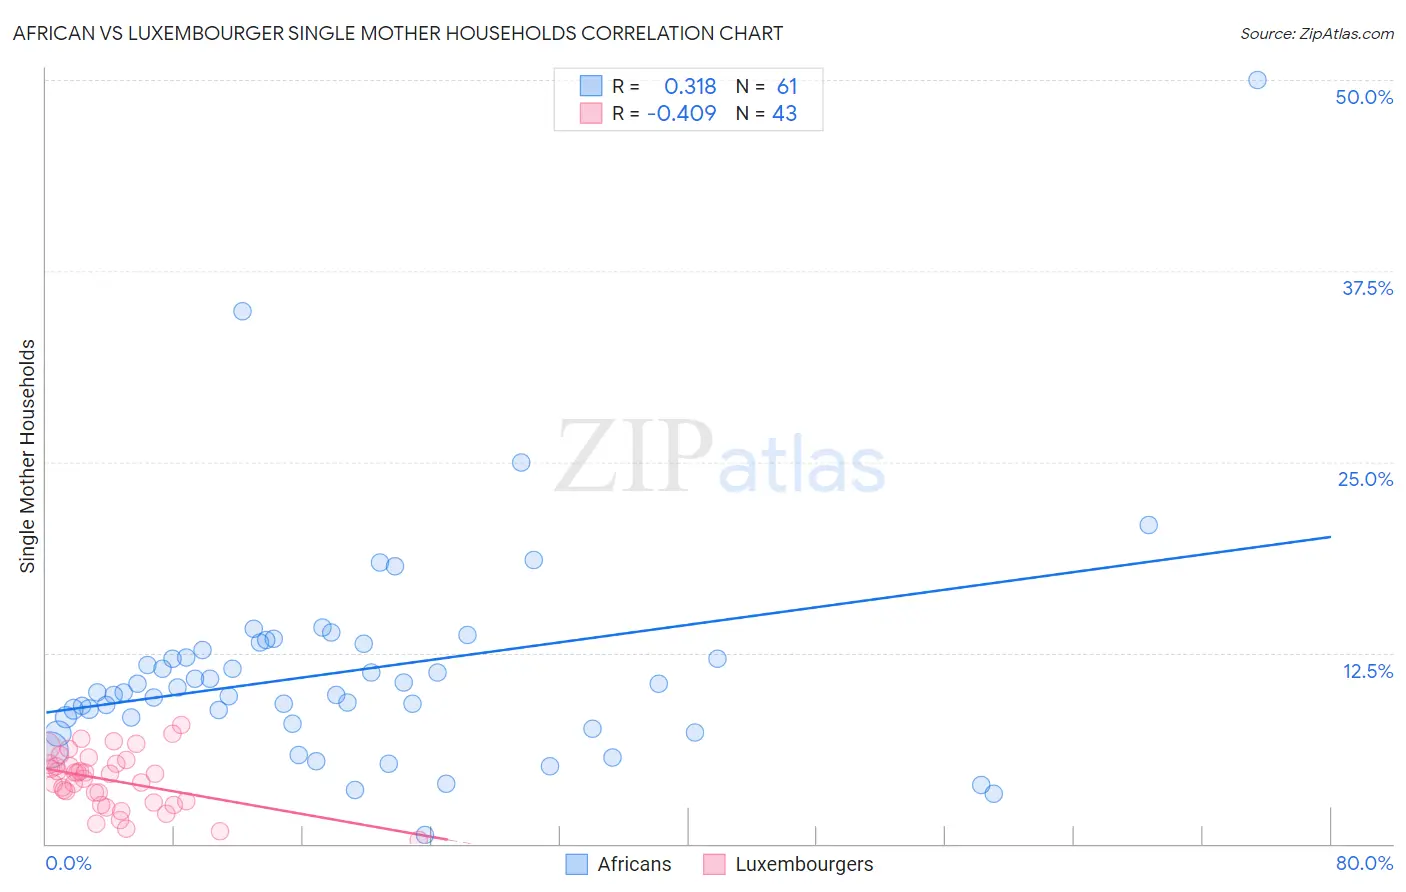
African vs Luxembourger Single Mother Households Correlation Chart
The statistical analysis conducted on geographies consisting of 468,558,446 people shows a mild positive correlation between the proportion of Africans and percentage of single mother households in the United States with a correlation coefficient (R) of 0.318 and weighted average of 8.2%. Similarly, the statistical analysis conducted on geographies consisting of 144,304,959 people shows a moderate negative correlation between the proportion of Luxembourgers and percentage of single mother households in the United States with a correlation coefficient (R) of -0.409 and weighted average of 5.6%, a difference of 47.1%.
Single Mother Households Correlation Summary
| Measurement | African | Luxembourger |
| Minimum | 0.60% | 0.28% |
| Maximum | 50.0% | 7.8% |
| Range | 49.4% | 7.5% |
| Mean | 11.3% | 4.1% |
| Median | 9.9% | 4.6% |
| Interquartile 25% (IQ1) | 8.1% | 2.7% |
| Interquartile 75% (IQ3) | 12.9% | 5.2% |
| Interquartile Range (IQR) | 4.8% | 2.5% |
| Standard Deviation (Sample) | 7.3% | 1.8% |
| Standard Deviation (Population) | 7.3% | 1.8% |
Similar Demographics by Single Mother Households
Demographics Similar to Africans by Single Mother Households
In terms of single mother households, the demographic groups most similar to Africans are Immigrants from Honduras (8.2%, a difference of 0.14%), Immigrants from Western Africa (8.2%, a difference of 0.15%), Immigrants from Mexico (8.2%, a difference of 0.17%), Immigrants from Grenada (8.2%, a difference of 0.29%), and Bangladeshi (8.1%, a difference of 0.46%).
| Demographics | Rating | Rank | Single Mother Households |
| Cheyenne | 0.0 /100 | #309 | Tragic 8.1% |
| Hondurans | 0.0 /100 | #310 | Tragic 8.1% |
| Immigrants | Congo | 0.0 /100 | #311 | Tragic 8.1% |
| Bangladeshis | 0.0 /100 | #312 | Tragic 8.1% |
| Immigrants | Grenada | 0.0 /100 | #313 | Tragic 8.2% |
| Immigrants | Mexico | 0.0 /100 | #314 | Tragic 8.2% |
| Immigrants | Western Africa | 0.0 /100 | #315 | Tragic 8.2% |
| Africans | 0.0 /100 | #316 | Tragic 8.2% |
| Immigrants | Honduras | 0.0 /100 | #317 | Tragic 8.2% |
| Senegalese | 0.0 /100 | #318 | Tragic 8.2% |
| Jamaicans | 0.0 /100 | #319 | Tragic 8.2% |
| Bahamians | 0.0 /100 | #320 | Tragic 8.3% |
| Immigrants | Senegal | 0.0 /100 | #321 | Tragic 8.3% |
| Pima | 0.0 /100 | #322 | Tragic 8.3% |
| Haitians | 0.0 /100 | #323 | Tragic 8.3% |
Demographics Similar to Luxembourgers by Single Mother Households
In terms of single mother households, the demographic groups most similar to Luxembourgers are Immigrants from Norway (5.6%, a difference of 0.15%), Australian (5.6%, a difference of 0.22%), Polish (5.6%, a difference of 0.23%), Immigrants from North Macedonia (5.6%, a difference of 0.29%), and Immigrants from France (5.6%, a difference of 0.33%).
| Demographics | Rating | Rank | Single Mother Households |
| Swedes | 99.1 /100 | #52 | Exceptional 5.5% |
| Immigrants | Russia | 99.1 /100 | #53 | Exceptional 5.5% |
| Immigrants | Lebanon | 99.1 /100 | #54 | Exceptional 5.5% |
| Immigrants | Denmark | 99.1 /100 | #55 | Exceptional 5.5% |
| Immigrants | Romania | 99.0 /100 | #56 | Exceptional 5.5% |
| Immigrants | Europe | 99.0 /100 | #57 | Exceptional 5.5% |
| Danes | 98.9 /100 | #58 | Exceptional 5.5% |
| Luxembourgers | 98.7 /100 | #59 | Exceptional 5.6% |
| Immigrants | Norway | 98.7 /100 | #60 | Exceptional 5.6% |
| Australians | 98.7 /100 | #61 | Exceptional 5.6% |
| Poles | 98.6 /100 | #62 | Exceptional 5.6% |
| Immigrants | North Macedonia | 98.6 /100 | #63 | Exceptional 5.6% |
| Immigrants | France | 98.6 /100 | #64 | Exceptional 5.6% |
| Greeks | 98.6 /100 | #65 | Exceptional 5.6% |
| Immigrants | Canada | 98.5 /100 | #66 | Exceptional 5.6% |