Pennsylvania German vs Indonesian Female Poverty Among 25-34 Year Olds
COMPARE
Pennsylvania German
Indonesian
Female Poverty Among 25-34 Year Olds
Female Poverty Among 25-34 Year Olds Comparison
Pennsylvania Germans
Indonesians
15.4%
FEMALE POVERTY AMONG 25-34 YEAR OLDS
0.1/ 100
METRIC RATING
264th/ 347
METRIC RANK
16.4%
FEMALE POVERTY AMONG 25-34 YEAR OLDS
0.0/ 100
METRIC RATING
290th/ 347
METRIC RANK
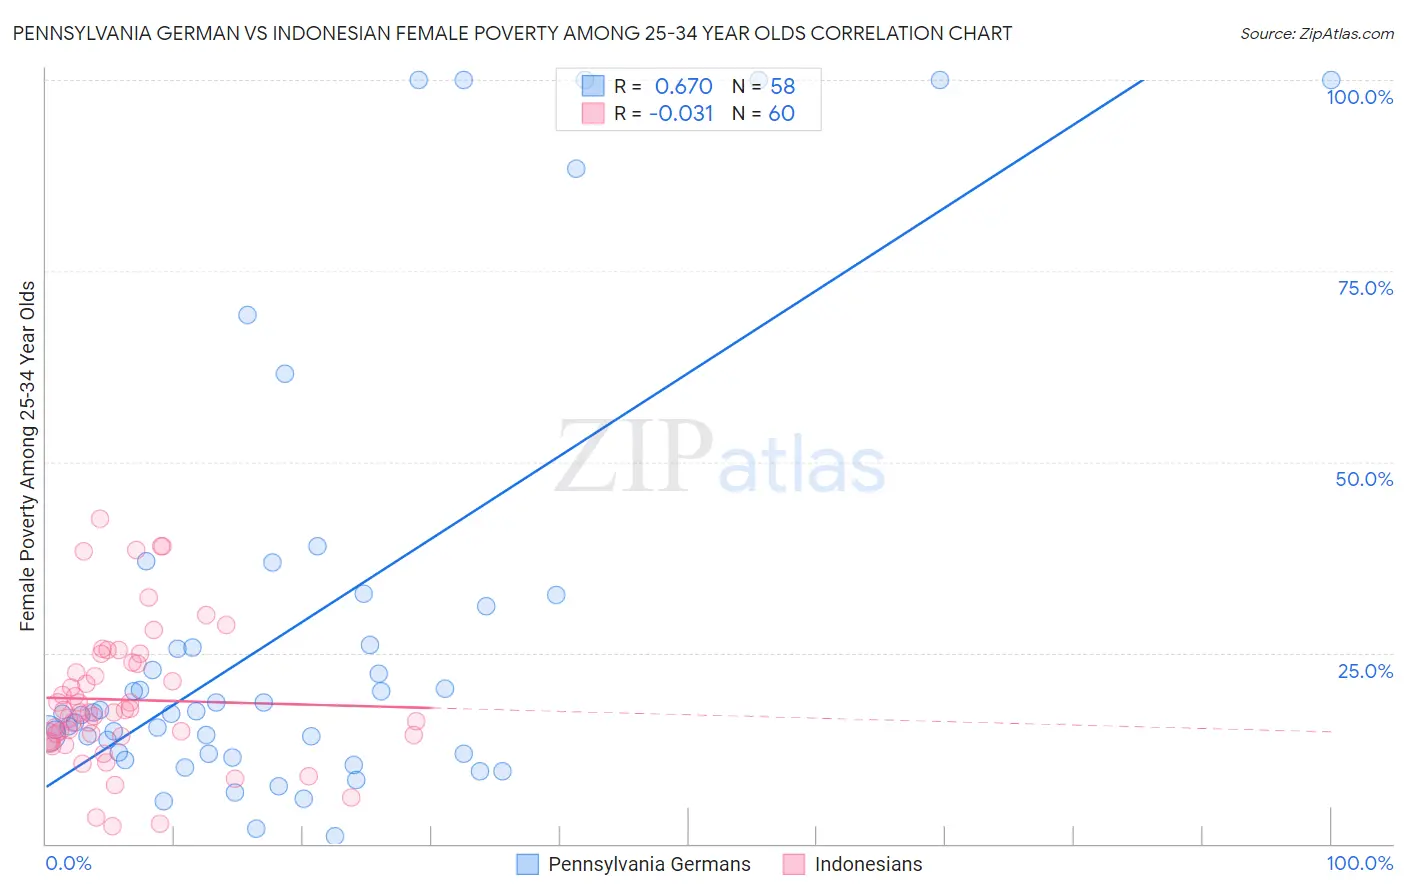
Pennsylvania German vs Indonesian Female Poverty Among 25-34 Year Olds Correlation Chart
The statistical analysis conducted on geographies consisting of 230,552,403 people shows a significant positive correlation between the proportion of Pennsylvania Germans and poverty level among females between the ages 25 and 34 in the United States with a correlation coefficient (R) of 0.670 and weighted average of 15.4%. Similarly, the statistical analysis conducted on geographies consisting of 161,815,054 people shows no correlation between the proportion of Indonesians and poverty level among females between the ages 25 and 34 in the United States with a correlation coefficient (R) of -0.031 and weighted average of 16.4%, a difference of 6.5%.
Female Poverty Among 25-34 Year Olds Correlation Summary
| Measurement | Pennsylvania German | Indonesian |
| Minimum | 1.0% | 2.3% |
| Maximum | 100.0% | 42.5% |
| Range | 99.0% | 40.2% |
| Mean | 28.5% | 18.9% |
| Median | 17.1% | 17.2% |
| Interquartile 25% (IQ1) | 11.8% | 14.1% |
| Interquartile 75% (IQ3) | 31.1% | 23.6% |
| Interquartile Range (IQR) | 19.3% | 9.6% |
| Standard Deviation (Sample) | 28.8% | 8.9% |
| Standard Deviation (Population) | 28.5% | 8.9% |
Similar Demographics by Female Poverty Among 25-34 Year Olds
Demographics Similar to Pennsylvania Germans by Female Poverty Among 25-34 Year Olds
In terms of female poverty among 25-34 year olds, the demographic groups most similar to Pennsylvania Germans are Immigrants from Liberia (15.4%, a difference of 0.030%), Immigrants from Somalia (15.4%, a difference of 0.040%), Central American (15.5%, a difference of 0.42%), Mexican American Indian (15.4%, a difference of 0.43%), and Immigrants from Belize (15.3%, a difference of 0.68%).
| Demographics | Rating | Rank | Female Poverty Among 25-34 Year Olds |
| Immigrants | Burma/Myanmar | 0.3 /100 | #257 | Tragic 15.2% |
| Nepalese | 0.2 /100 | #258 | Tragic 15.2% |
| Immigrants | Cuba | 0.2 /100 | #259 | Tragic 15.2% |
| Marshallese | 0.2 /100 | #260 | Tragic 15.3% |
| Liberians | 0.2 /100 | #261 | Tragic 15.3% |
| Immigrants | Belize | 0.2 /100 | #262 | Tragic 15.3% |
| Mexican American Indians | 0.2 /100 | #263 | Tragic 15.4% |
| Pennsylvania Germans | 0.1 /100 | #264 | Tragic 15.4% |
| Immigrants | Liberia | 0.1 /100 | #265 | Tragic 15.4% |
| Immigrants | Somalia | 0.1 /100 | #266 | Tragic 15.4% |
| Central Americans | 0.1 /100 | #267 | Tragic 15.5% |
| Immigrants | Senegal | 0.1 /100 | #268 | Tragic 15.6% |
| Sub-Saharan Africans | 0.1 /100 | #269 | Tragic 15.6% |
| British West Indians | 0.1 /100 | #270 | Tragic 15.6% |
| Cree | 0.1 /100 | #271 | Tragic 15.6% |
Demographics Similar to Indonesians by Female Poverty Among 25-34 Year Olds
In terms of female poverty among 25-34 year olds, the demographic groups most similar to Indonesians are Osage (16.4%, a difference of 0.16%), Guatemalan (16.4%, a difference of 0.22%), Comanche (16.5%, a difference of 0.28%), Immigrants from Dominica (16.5%, a difference of 0.30%), and American (16.4%, a difference of 0.40%).
| Demographics | Rating | Rank | Female Poverty Among 25-34 Year Olds |
| Bahamians | 0.0 /100 | #283 | Tragic 16.1% |
| Shoshone | 0.0 /100 | #284 | Tragic 16.2% |
| Immigrants | Bahamas | 0.0 /100 | #285 | Tragic 16.3% |
| Cape Verdeans | 0.0 /100 | #286 | Tragic 16.3% |
| Americans | 0.0 /100 | #287 | Tragic 16.4% |
| Guatemalans | 0.0 /100 | #288 | Tragic 16.4% |
| Osage | 0.0 /100 | #289 | Tragic 16.4% |
| Indonesians | 0.0 /100 | #290 | Tragic 16.4% |
| Comanche | 0.0 /100 | #291 | Tragic 16.5% |
| Immigrants | Dominica | 0.0 /100 | #292 | Tragic 16.5% |
| Potawatomi | 0.0 /100 | #293 | Tragic 16.5% |
| Immigrants | Central America | 0.0 /100 | #294 | Tragic 16.6% |
| Mexicans | 0.0 /100 | #295 | Tragic 16.6% |
| Hispanics or Latinos | 0.0 /100 | #296 | Tragic 16.6% |
| Immigrants | Guatemala | 0.0 /100 | #297 | Tragic 16.6% |