Afghan vs Tlingit-Haida Child Poverty Among Girls Under 16
COMPARE
Afghan
Tlingit-Haida
Child Poverty Among Girls Under 16
Child Poverty Among Girls Under 16 Comparison
Afghans
Tlingit-Haida
16.2%
CHILD POVERTY AMONG GIRLS UNDER 16
62.3/ 100
METRIC RATING
172nd/ 347
METRIC RANK
14.7%
CHILD POVERTY AMONG GIRLS UNDER 16
97.9/ 100
METRIC RATING
77th/ 347
METRIC RANK
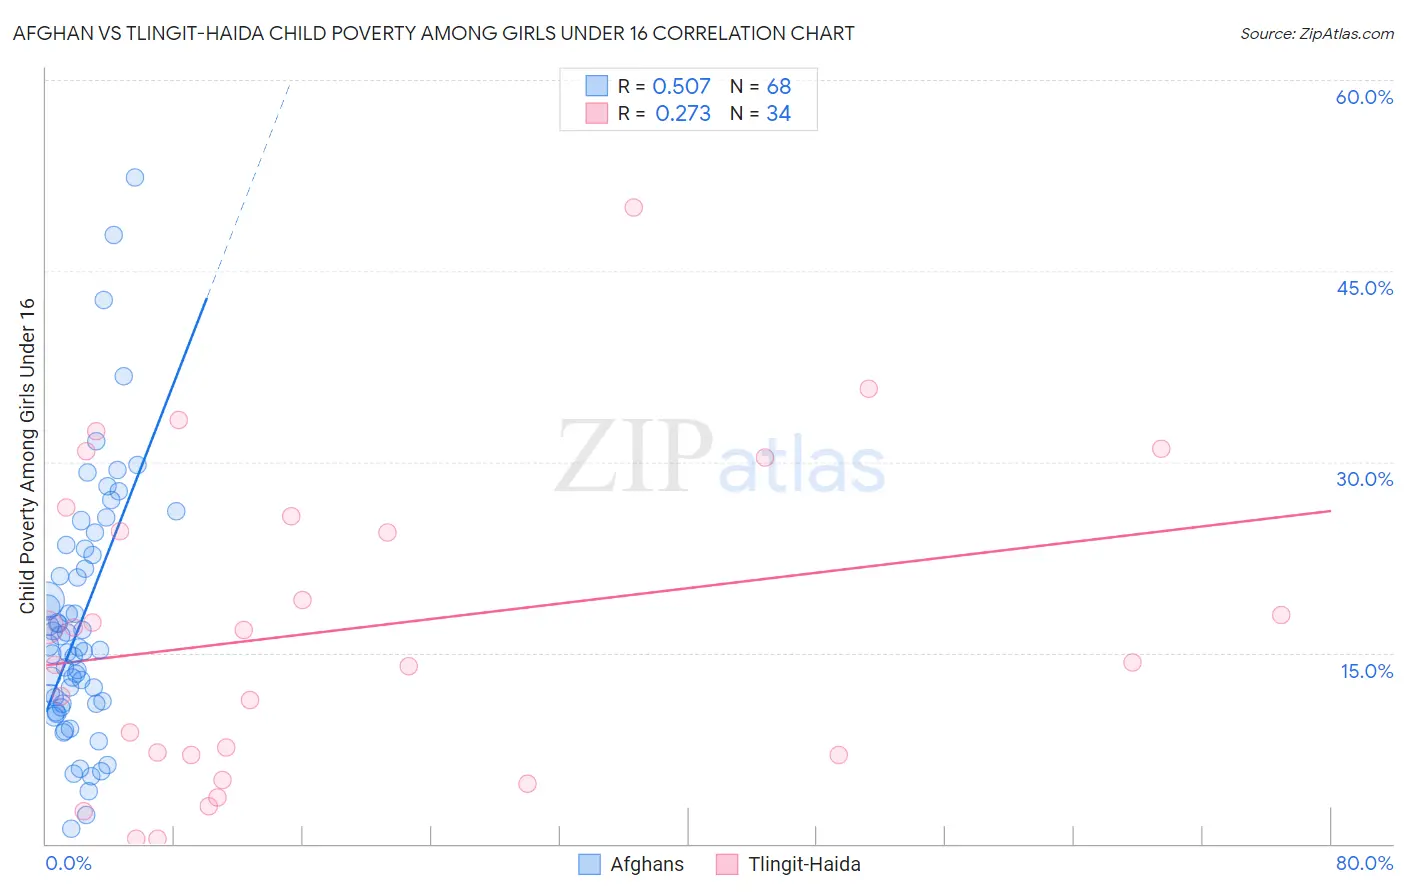
Afghan vs Tlingit-Haida Child Poverty Among Girls Under 16 Correlation Chart
The statistical analysis conducted on geographies consisting of 147,871,316 people shows a substantial positive correlation between the proportion of Afghans and poverty level among girls under the age of 16 in the United States with a correlation coefficient (R) of 0.507 and weighted average of 16.2%. Similarly, the statistical analysis conducted on geographies consisting of 60,606,017 people shows a weak positive correlation between the proportion of Tlingit-Haida and poverty level among girls under the age of 16 in the United States with a correlation coefficient (R) of 0.273 and weighted average of 14.7%, a difference of 10.7%.
Child Poverty Among Girls Under 16 Correlation Summary
| Measurement | Afghan | Tlingit-Haida |
| Minimum | 1.2% | 0.43% |
| Maximum | 52.3% | 50.0% |
| Range | 51.1% | 49.6% |
| Mean | 17.5% | 16.8% |
| Median | 15.3% | 15.6% |
| Interquartile 25% (IQ1) | 11.0% | 7.0% |
| Interquartile 75% (IQ3) | 23.0% | 25.7% |
| Interquartile Range (IQR) | 12.0% | 18.7% |
| Standard Deviation (Sample) | 10.0% | 12.0% |
| Standard Deviation (Population) | 10.0% | 11.8% |
Similar Demographics by Child Poverty Among Girls Under 16
Demographics Similar to Afghans by Child Poverty Among Girls Under 16
In terms of child poverty among girls under 16, the demographic groups most similar to Afghans are Immigrants from Saudi Arabia (16.2%, a difference of 0.21%), Costa Rican (16.2%, a difference of 0.24%), Immigrants from Venezuela (16.2%, a difference of 0.24%), Yugoslavian (16.2%, a difference of 0.26%), and Uruguayan (16.2%, a difference of 0.30%).
| Demographics | Rating | Rank | Child Poverty Among Girls Under 16 |
| Immigrants | Germany | 67.3 /100 | #165 | Good 16.1% |
| South Americans | 67.2 /100 | #166 | Good 16.1% |
| Uruguayans | 64.7 /100 | #167 | Good 16.2% |
| Yugoslavians | 64.4 /100 | #168 | Good 16.2% |
| Costa Ricans | 64.2 /100 | #169 | Good 16.2% |
| Immigrants | Venezuela | 64.2 /100 | #170 | Good 16.2% |
| Immigrants | Saudi Arabia | 64.0 /100 | #171 | Good 16.2% |
| Afghans | 62.3 /100 | #172 | Good 16.2% |
| Immigrants | South America | 55.1 /100 | #173 | Average 16.4% |
| Ethiopians | 50.0 /100 | #174 | Average 16.5% |
| Lebanese | 45.4 /100 | #175 | Average 16.6% |
| Hungarians | 45.1 /100 | #176 | Average 16.6% |
| Immigrants | Western Asia | 44.1 /100 | #177 | Average 16.6% |
| Whites/Caucasians | 43.6 /100 | #178 | Average 16.6% |
| Hawaiians | 43.4 /100 | #179 | Average 16.6% |
Demographics Similar to Tlingit-Haida by Child Poverty Among Girls Under 16
In terms of child poverty among girls under 16, the demographic groups most similar to Tlingit-Haida are Immigrants from Russia (14.7%, a difference of 0.010%), Argentinean (14.7%, a difference of 0.010%), Immigrants from Turkey (14.7%, a difference of 0.020%), Egyptian (14.7%, a difference of 0.030%), and Immigrants from Eastern Europe (14.6%, a difference of 0.16%).
| Demographics | Rating | Rank | Child Poverty Among Girls Under 16 |
| Europeans | 98.1 /100 | #70 | Exceptional 14.6% |
| Slovenes | 98.1 /100 | #71 | Exceptional 14.6% |
| Immigrants | Netherlands | 98.1 /100 | #72 | Exceptional 14.6% |
| Immigrants | Austria | 98.0 /100 | #73 | Exceptional 14.6% |
| Taiwanese | 98.0 /100 | #74 | Exceptional 14.6% |
| Immigrants | Eastern Europe | 98.0 /100 | #75 | Exceptional 14.6% |
| Immigrants | Russia | 97.9 /100 | #76 | Exceptional 14.7% |
| Tlingit-Haida | 97.9 /100 | #77 | Exceptional 14.7% |
| Argentineans | 97.9 /100 | #78 | Exceptional 14.7% |
| Immigrants | Turkey | 97.9 /100 | #79 | Exceptional 14.7% |
| Egyptians | 97.9 /100 | #80 | Exceptional 14.7% |
| Ukrainians | 97.7 /100 | #81 | Exceptional 14.7% |
| Macedonians | 97.6 /100 | #82 | Exceptional 14.7% |
| Immigrants | Italy | 97.4 /100 | #83 | Exceptional 14.8% |
| Soviet Union | 97.3 /100 | #84 | Exceptional 14.8% |